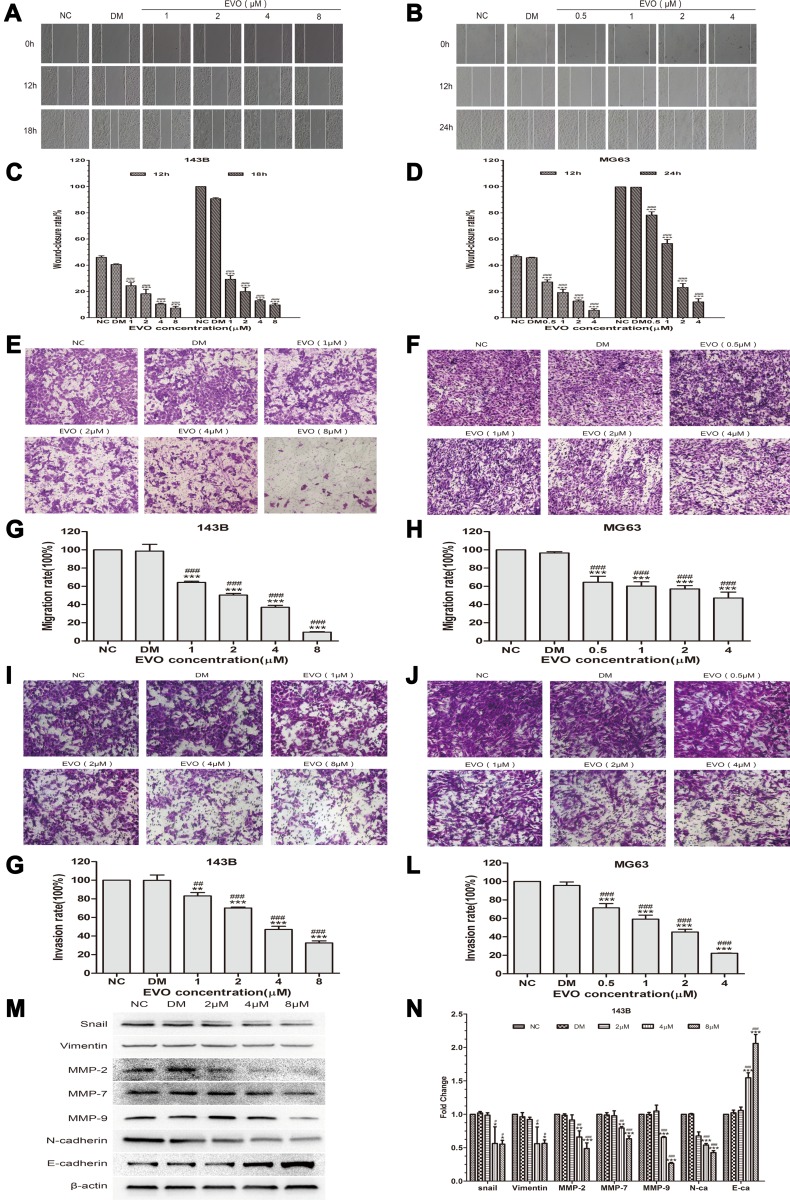
Figure 4.
EVO suppresses the migration and invasion of 143B and MG63 cells. (A and B) The wound-healing assay showed the migratory abilities of 143B and MG63 cells treated with different concentrations of EVO or DMSO. Photographs were respectively obtained at 0h, 12h and 18h for 143B cells while 0, 12 and 24 hours for MG63 cells. (C and D) Representative statistical plots are presented. The data are presented as the mean ± SD (n=3, each group). ***p<0.001 vs NC group; ###p<0.001 vs DMSO group. (E and F) Representative figure of 143B and MG63 cells treated with different concentrations of EVO or DMSO in the transwell migration assay. (G and H) The amounts of migrated cells were counted under five randomly visual fields. The data are presented as the mean ± SD (n=3, each group). ***p<0.001 vs NC group; ###p<0.001 vs DMSO group. (I and J) Representative figure of 143B and MG63 cells treated with different concentrations of EVO or DMSO in the transwell matrigel invasion assay. (K and L) The amounts of invaded cells were counted under five randomly visual fields. The data are presented as the mean ± SD (n=3, each group). **p<0.01, ***p<0.001 vs NC group; ##p<0.01, ###p<0.001 vs DMSO group. (M and N) EMT-related markers including E-cadherin, vimentin and N-cadherin; EMT transcription factors Snail and MMPs including MMP-2, MMP-7 and MMP-9 in 143B cells treated with different concentrations of EVO or DMSO were analyzed by Western blotting. β-Actin was served as a loading control. The quantitative data are presented as the mean ± SD (n=3, each group). *p<0.05, **p<0.01, ***p<0.001 vs NC group; #p<0.05, ##p<0.01, ###p<0.001 vs DMSO group.

