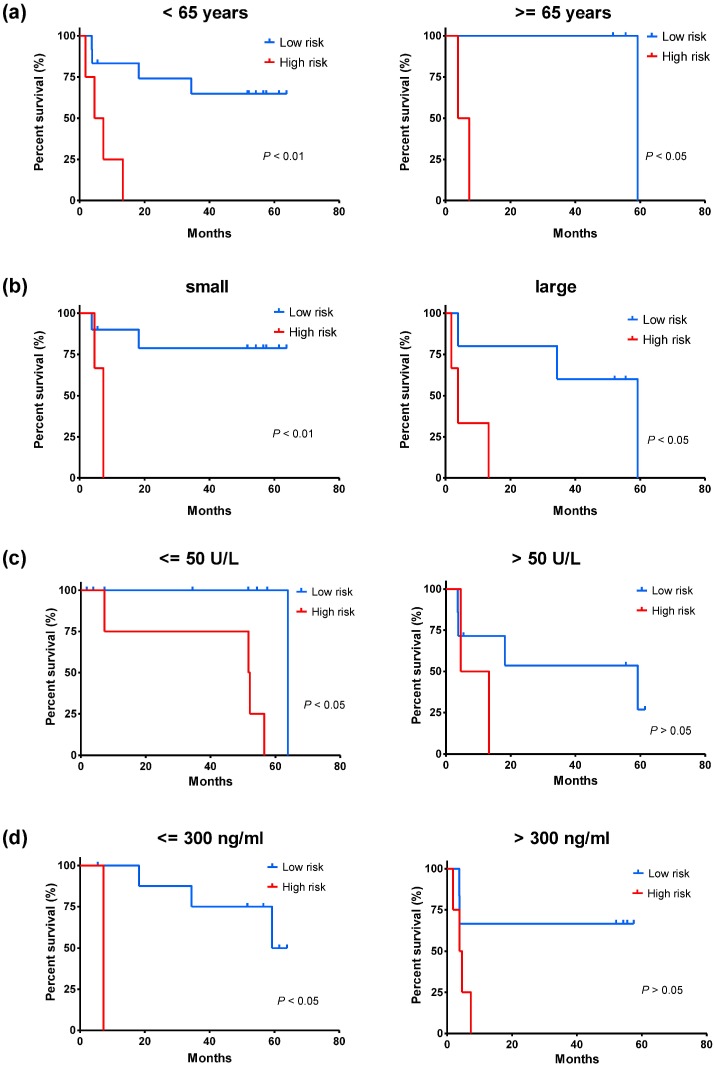
Figure 4.
Kaplan-Meier estimates of the overall survival of patients from the discovery set (GPL571) with different ages, tumor size, ALT levels, and AFP levels. The patients were divided into low-risk and high-risk groups using the same cutoff value that was determined by ROC curve of the whole group. (a) Kaplan-Meier analysis for patients of different ages. (b) Kaplan-Meier analysis for patients with different tumor size, tumor <= 5cm, small, and tumor > 5cm, large. (c) Kaplan-Meier analysis for patients with different ALT levels. (d) Kaplan-Meier analysis for patients with different AFP levels. A two-sided log-rank test was performed to evaluate the survival differences between the two curves. The statistical significance level was 0.05.

