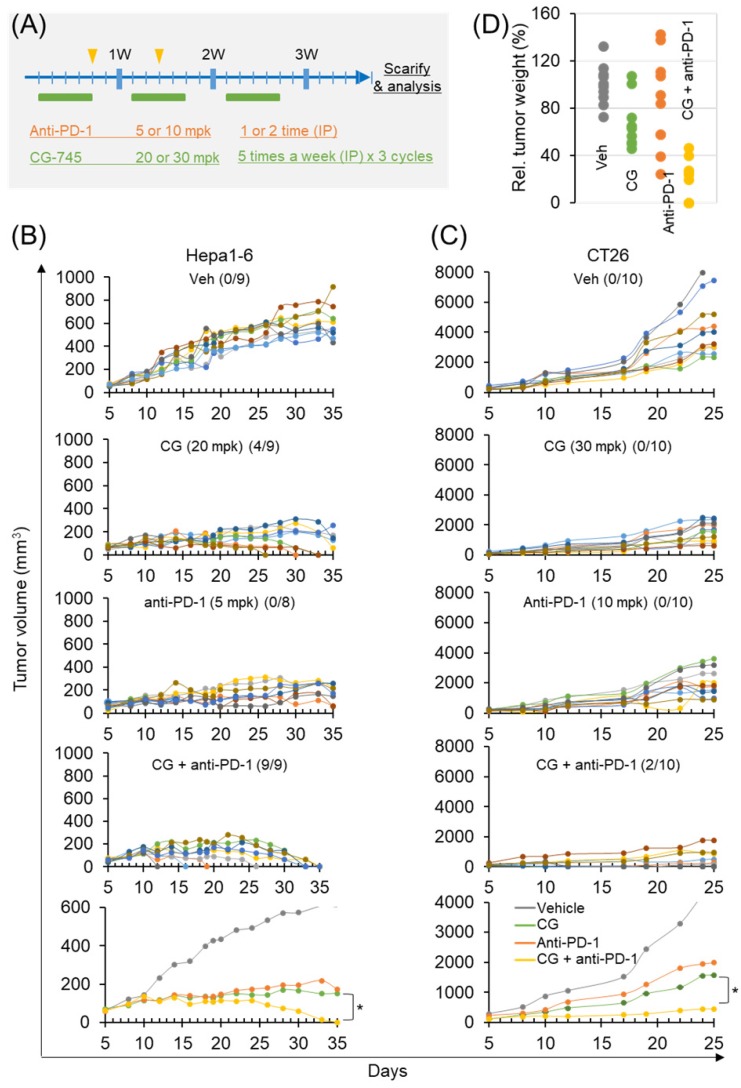
Figure 5.
Anti-cancer efficacy of PD-1 antibody was increased by CG-745 co-treatment in Hepa1-6 and CT26 syngeneic mouse models: (A) A schematic diagram of the treatment schedule; (B, C) Hepa1-6 (B) or CT26 (C) syngeneic mice were injected with 20 (B) or 30 mg/kg (C) of CG (5 days per week for 3 weeks intraperitoneally (IP)). The anti-PD-1 antibody was treated alone or in combination with CG as indicated by the arrow and rectangle in Figure 5A. Tumor volume at indicated time points after treatment was plotted. The line graph shows tumor volume of individual mouse or average of mice (bottom); The numbers in parentheses indicate tumor free mice/total mice. (D) Representative tumor weights at the end of the experiment. Tumor tissues were collected from individual mouse.

