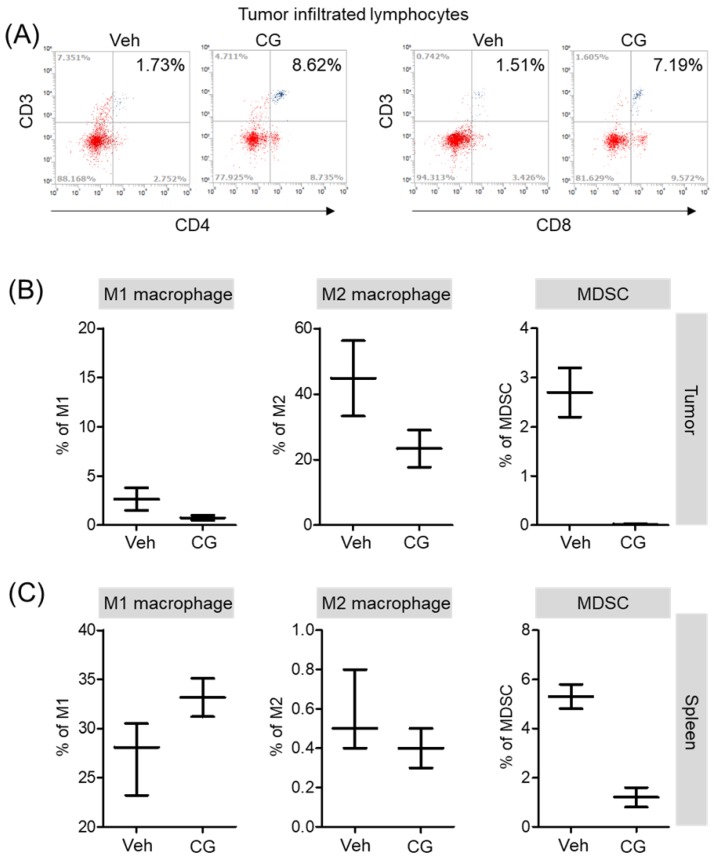
Figure 6.
The proportion of MDSCs and M1/M2 macrophage were changed by CG-745 treatment in Hepa1-6 syngeneic mouse model: (A-C) Hepa1-6 inoculated C57BL/6 mice were treated with vehicle or 15 mg/kg/day of CG (CG-745) by intraperitoneally for 5 days/week for 3 weeks. Tumor (A, B) and spleen (C) were harvested from each individual mouse. Cells were stained with fluorescence-conjugated antibodies specific to CD3, CD4, CD8, CD25 and Foxp3, and subjected to flow cytometry analysis. The graph shows means with error bars. Error bars represent standard deviations for 3 samples in each group. Results are representative of three separate experiments (A). p < 0.05.

