Figure 5.

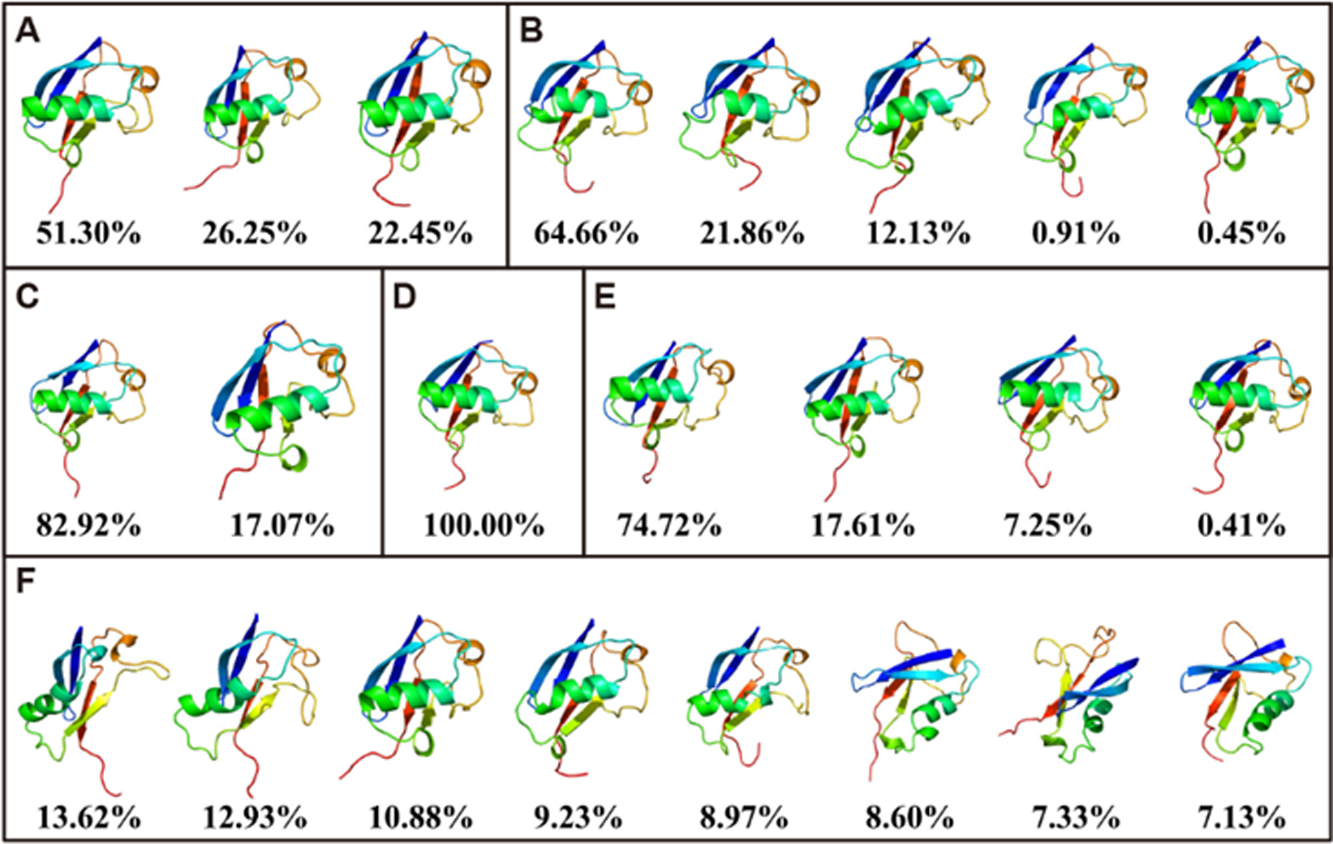
Conformation clustering of simulation for ubiquitin. The figure shows the top 8 clusters at most with dominant conformations and percentage for ff03 (A), ff03* (B), ff03w (C), ff03CMAP/TIP4PEw (D), ff03CMAP/TIP4PD (E), and ff03ws (F).

Conformation clustering of simulation for ubiquitin. The figure shows the top 8 clusters at most with dominant conformations and percentage for ff03 (A), ff03* (B), ff03w (C), ff03CMAP/TIP4PEw (D), ff03CMAP/TIP4PD (E), and ff03ws (F).