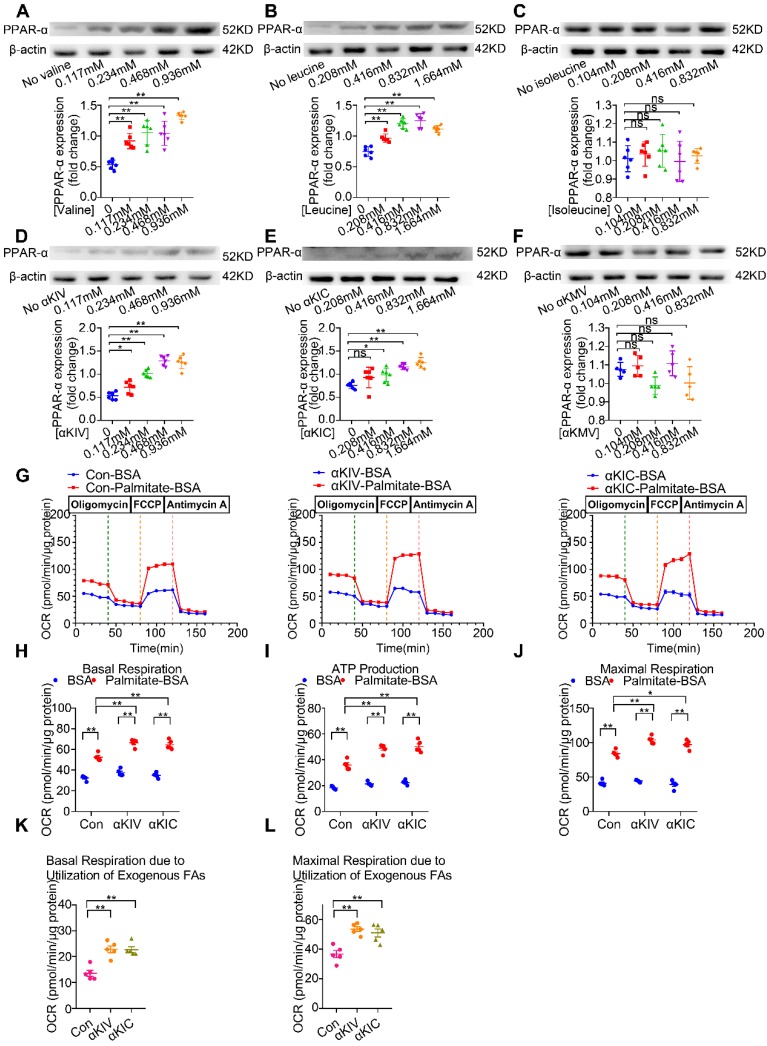
Figure 5.
The effects of BCAA/BCKA on FAO level and PPAR-α expression in cardiac myocytes. (A) Expression of PPAR-α in the presence of increasing concentrations of valine (0, 0.117 mM, 0.234 mM, 0.468 mM, 0.936 mM) by western blotting (n=5-6). (B) Expression of PPAR-α at different concentrations of leucine (0, 0.208 mM, 0.416 mM, 0.832 mM, 1.664 mM) (n=5-6). (C) PPAR-α expression at different concentrations of isoleucine (0, 0.104 mM, 0.208 mM, 0.416 mM, 0.832 mM) (n=5-6). (D) Expression of PPAR-α in the presence of increasing concentrations of a-ketoisovaleric acid (αKIV) (0, 0.117 mM, 0.234 mM, 0.468 mM, 0.936 mM) (n=5-6). (E) Expression of PPAR-α at increasing concentrations of α-ketoisocaproic acid (αKIC) (0, 0.208 mM, 0.416 mM, 0.832 mM, 1.664 mM) (n=5-6). (F) PPAR-α expression at increasing concentrations of α-keto-β-methylvaleric acid (αKMV) (0, 0.104 mM, 0.208 mM, 0.416 mM, 0.832 mM) (n=5-6). (G to L) Adult mouse cardiac myocytes were treated with vehicle (Con), αKIV (0.936 mM) and αKIC (1.664 mM) for 12 h. FAO levels were determined by seahorse analyzer (n=5). (G) OCR curve of Con group, αKIV group and αKIC group were determined. (H) Basal respiration (I) ATP production (J) maximal respiration (K) basal respiration due to exogenous FAs and (L) maximal respiration due to exogenous FAs were calculated according to instruction. Data were analyzed by one-way ANOVA, followed by a Bonferroni post-hoc test. * P<0.05. ** P<0.01. All values are presented as mean ± SEM.

