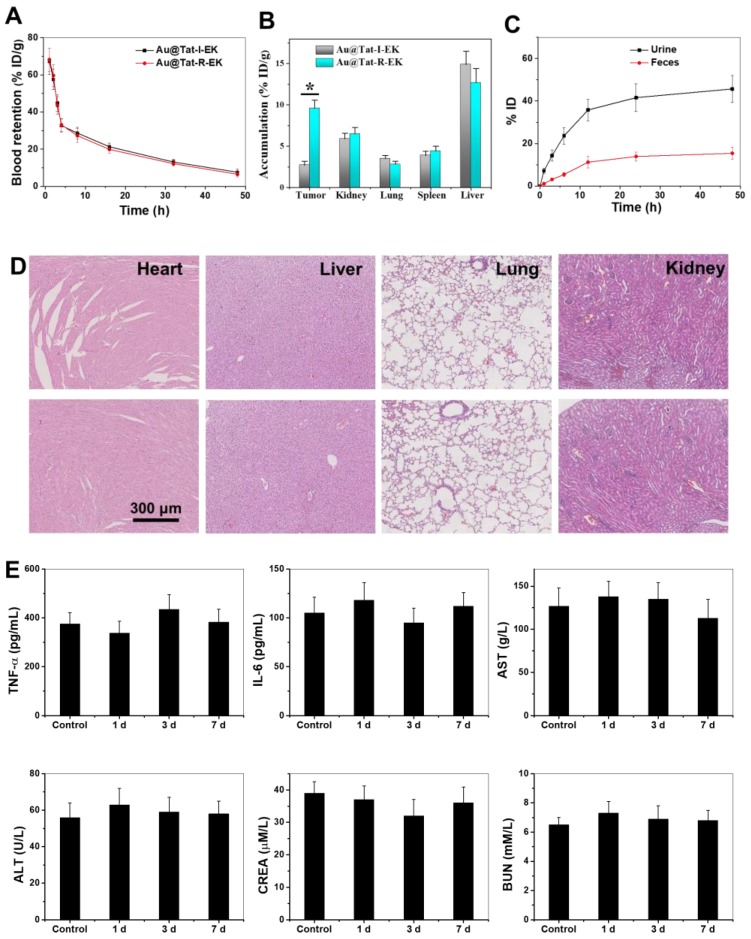
Figure 5.
Biodistribution, clearance and biocompatibility of Au NPs in vivo. (A) The blood concentration of ultrasmall Au NPs as a function of time after intravenous injection. (B) The tissue distribution of ultrasmall Au NPs 24 h after intravenous injection. (C) Cumulative urine and feces excretion at different time points (n=4). * indicates significant difference between different groups within same time frame at P < 0.05 level. (D) Representative images of H&E stained major organs from mice treated with PBS and Au@Tat-R-EK NPs (50 mg/kg), respectively. Scale bar is 300 μm. (E) Blood test results of mice received Au@Tat-R-EK NPs i.v. injection once (n=4).

