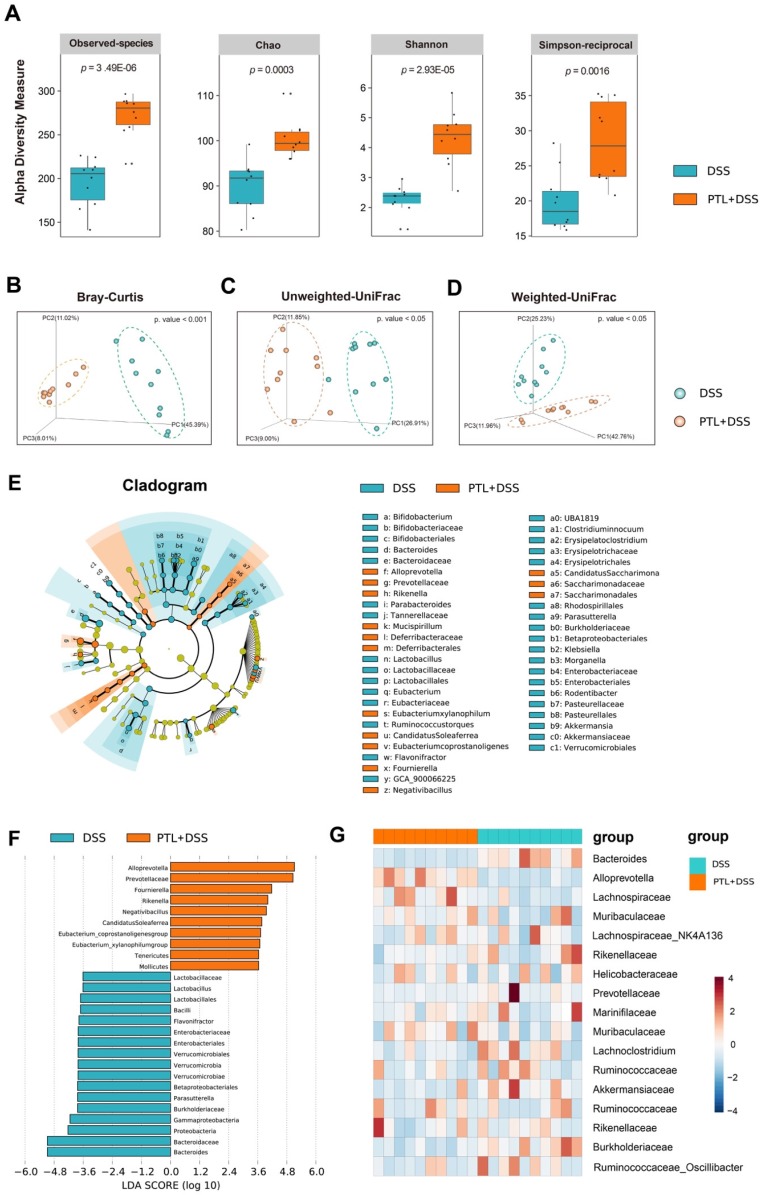
Figure 4.
PTL treatment significantly altered the gut microbiota diversity and composition. (A) Alpha diversity boxplot (observed species, Chao, Shannon and Simpson reciprocal). (B) Principal coordinate analysis (PCoA) using Bray-Curtis metric distances of beta diversity. (C) PCoA using Unweighted-UniFrad of beta diversity. (D) PCoA using Weighted-UniFrad of beta diversity. (E) Taxonomic cladogram from LEfSe, depicting taxonomic association from between microbiome communities from DSS and PTL+DSS groups. Each node represents a specific taxonomic type. Yellow nodes denote the taxonomic features that are not significantly differentiated between DSS and PTL+DSS groups. Orange nodes denote the taxonomic types with more abundance in PTL+DSS than in DSS group, while the blue nodes represent the taxonomic types more abundant in DSS group. (F) LDA score computed from features differentially abundant between DSS and PTL+DSS groups. The criteria for feature selection is log LDA score > 3.6. (G) Heatmap of selected most differentially abundant features at the genus level. The blue color represents less abundant, white color represents intermediate abundance and red represents the most abundant. (A-G) n = 10 samples per group. Each symbol represents an individual mouse. Data are pooled in one independent experiment with n = 10 mice per group.

