Figure 1.
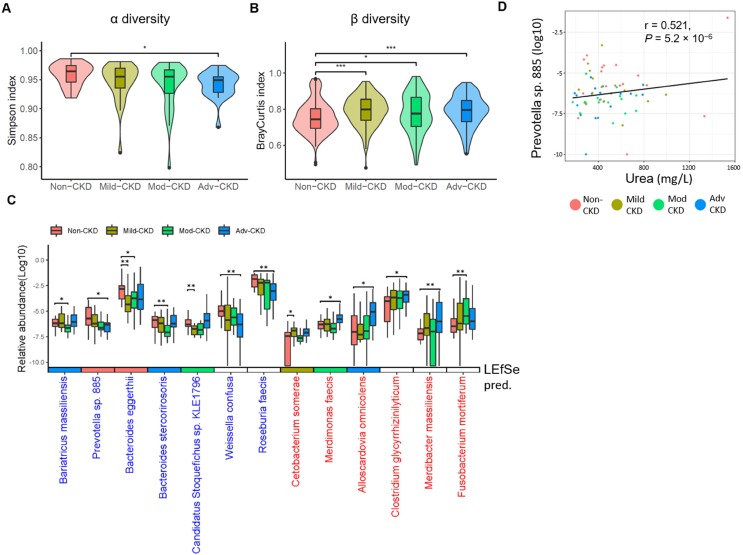
Severity-specific changes in bacterial diversities and taxonomic signatures. α-diversity (A) and β-diversity (B) among the groups were estimated by the Simpson and Bray-Curtis similarity indexes, respectively. The box-plot shows the median, the 25th, and the 75th percentile in each group. Simpson index was analyzed using Wilcoxon rank sum test, and Bray-Curtis distance between groups was calculated by Student's t test. *, p <0.05; ***, p <0.001; Mod-CKD (moderate CKD); Adv-CKD (advanced CKD). (C) Relative abundances of species among different groups were analyzed by Wilcoxon rank sum test. **, p < 0.005; *, p < 0.01. Species in red and blue denote CKD-enriched and -decreased markers, and the color in the box below represents significant species for the indicated group predicted by using LEfSe. (D) The relationship between Prevotella sp. 885 and urinary urea excretion determined by Pearson correlation (r = 0.521, P = 5.2 × 10⁻⁶).

