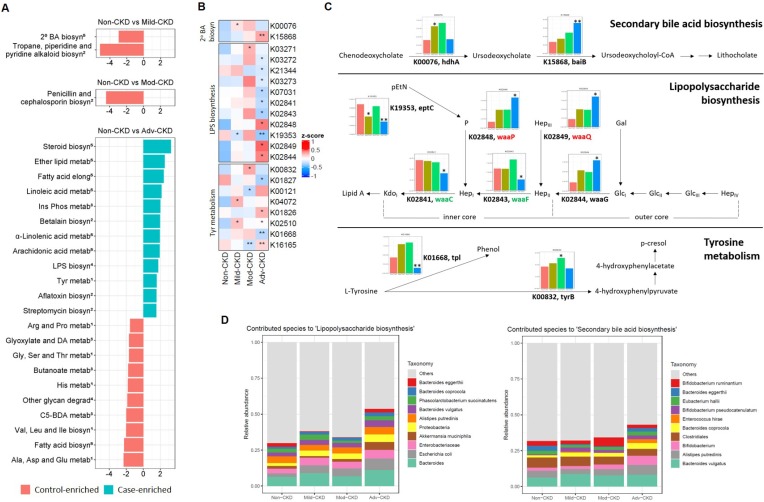
Figure 4.
CKD-associated changes in gut microbial function and their metabolomic associations. (A) Comparisons of the relative abundance of KEGG modules (from 5 selected pathways in metabolism: 1amino acid metabolism; 2biosynthesis of other secondary metabolites; 3carbohydrate metabolism; 4glycan biosynthesis and metabolism; 5lipid metabolism) between each CKD severity group and controls by using the reporter score. 2o BA biosyn, secondary bile acid biosynthesis; Ins Phos metab, Inositol phosphate metabolism; Glyoxylate and DA metab, Glyoxylate and dicarboxylate metabolism; C5-BDA metab, C5-branched dibasic acid metabolism. (B) Abundance of KO genes involved in representative pathway modules showed significant difference(s) in at least one CKD severity group. KO genes with the prevalence of 5% or higher are shown. Significant changes are denoted as follows: **, P < 0.01; *, P < 0.05, by Wilcoxon rank sum test. (C) Changes in gene abundance in (B) are shown in a simplified pathway presentation. For LPS biosynthesis, the structure and biosynthesis of the core oligosaccharide of LPS in E. coli K-12 are shown. Glycosyltransferases that construct the inner core backbone are shown in green; enzymes that modify the structure of inner core are shown in red. The inner core, containing residues of 3-deoxy-D-manno-octulosonic acid (Kdo) and L-glycero-D-manno-heptose (Hep), is often decorated with phosphate (P), while the outer core region typically contains glucose (Glc) and Hep. Gal, galactose; pEtN, phosphorylethanolamine. (D) Relative abundance of bacterial species associated with representative KEGG modules. Top 10 dominant bacterial species are denoted by color (right), and the remaining ones are assigned as others.

