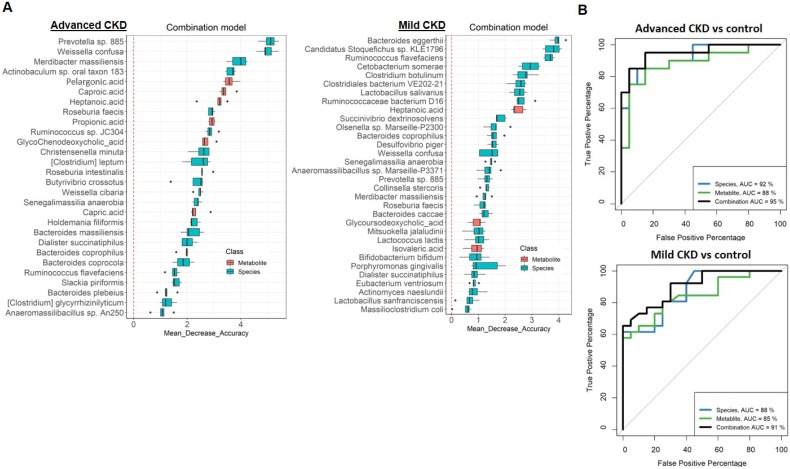
Figure 5.
(A) Metagenomic and metabolomic markers for detecting patients with advanced CKD (right, n=20) and early-stage CKD (left, n=26) from the controls (n=28) identified from Random Forests classifiers based on the combination of dual-omics markers. Markers are ranked in descending order of their importance to the accuracy of the model. The boxes represent 25th-75th percentiles, and black lines indicate the median. (B) ROC curves depict trade-offs between true and false positive rates for detecting patients with advanced and early-stage CKD as classification stringency varies. AUC, the total area under the ROC curve.

