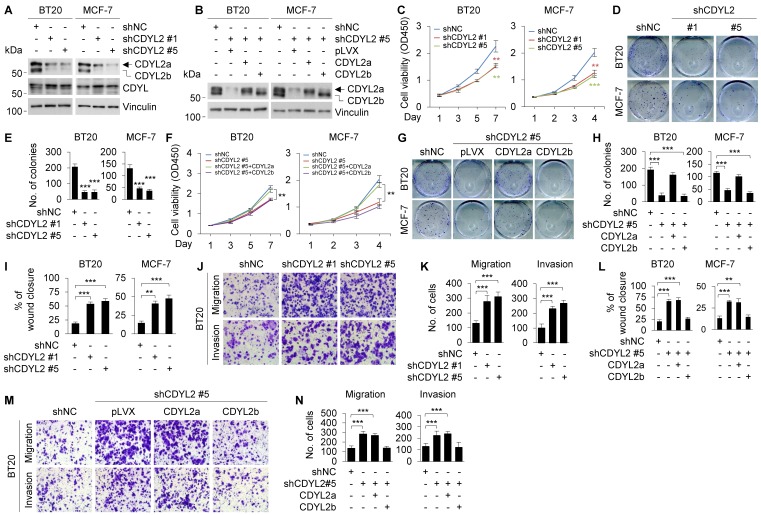
Figure 3.
Re-expression of CDYL2a restores the impaired cell proliferation of CDYL2-depleted cells, while re-expression of CDYL2b reverses the enhanced cell migratory and invasive potential of CDYL2-depleted cells. (A) Immunoblotting analysis of CDYL2 protein expression in BT20 and MCF-7 cells stably expressing shNC, shCDYL2 #1, or shCDYL2 #5 with an anti-CDYL2 antibody. Vinculin was used as a loading control. (B) CDYL2-depleted BT20 and MCF-7 cells were reconstituted with Flag-CDYL2a or Flag-CDYL2b by lentiviral infection. The expression status of CDYL2a and CDYL2b in these cell lines was validated with immunoblotting analysis using an anti-CDYL2 antibody. Vinculin was used as a loading control. (C-E) BT20 and MCF-7 cells stably expressing shNC, shCDYL2 #1, or shCDYL2 #5 were subjected to cell proliferation assays using CCK-8 (C) and colony growth assays (D-E). Representative images of the colonies (D) and quantitative results (E) are shown. (F-H) CDYL2-depleted BT20 and MCF-7 cells were reconstituted with Flag-CDYL2a and Flag-CDYL2b by lentiviral infection and then subjected to cell proliferation assays using CCK-8 (F) and colony growth assays (G-H). Representative images of the colonies (G) and quantitative results (H) are shown. (I-K) BT20 and MCF-7 cells stably expressing shNC, shCDYL2#1, or shCDYL2#5 were subjected to wound-healing assays (I), Boyden's chamber migration assays and Matrigel-coated invasion assays (J-K). Representative images of wound-healing assays are shown in Supplementary Figure S9B and the corresponding quantitative results are shown in I. Representative images of Transwell migration and invasion assays are shown in J and the corresponding quantitative results are shown in K. (L-N) CDYL2-depleted BT20 and MCF-7 cells were reconstituted with Flag-CDYL2a and Flag-CDYL2b by lentiviral infection and then subjected to wound-healing assays (L), Boyden's chamber migration assays, and Matrigel-coated invasion assays (M-N). Representative images of wound-healing assays are shown in Supplementary Figure S9C and the corresponding quantitative results are shown in L. Representative images of Transwell migration and invasion assays are shown in M and corresponding quantitative results are shown in N. ** and *** are significant differences at p<0.01 and p<0.001, respectively.

