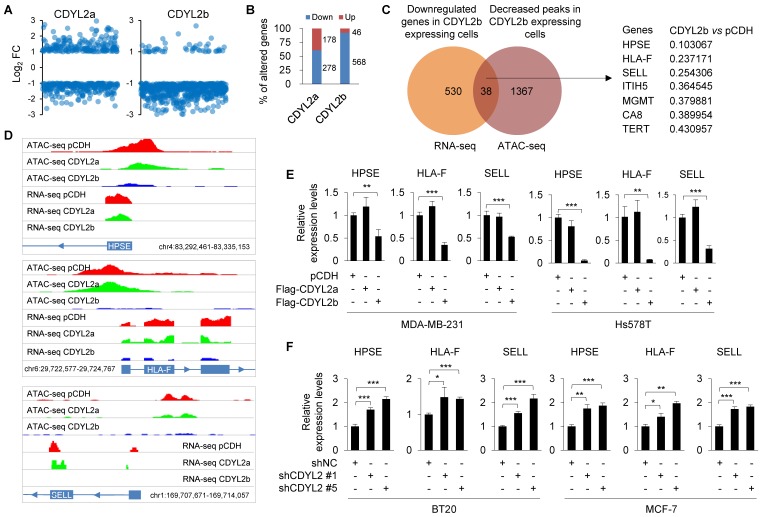
Figure 6.
CDYL2b transcriptionally represses HPSE, HLA-F, and SELL expression. (A) Hs578T cells stably expressing pCDH, Flag-CDYL2a, and Flag-CDYL2b were subjected to RNA-seq analysis. The distribution of differentially expressed genes in CDYL2a or CDYL2b overexpressing cells is shown. (B) The percentage of upregulated or downregulated genes in CDYL2a or CDYL2b overexpressing H578T cells is shown. (C) Integrative analysis of RNA-seq and ATAC-seq results. Venn diagram showing overlapping genes (n = 38) between the downregulated genes from RNA-Seq and genes with decreased chromatin accessibility from ATAC-seq in CDYL2b overexpressing cells compared to pCDH expressing control cells. (D) RNA-seq and ATAC-seq reads around transcription starting sites of HPSE, HLA-F, and SELL genes are shown. (E) qPCR analysis of the expression levels of HPSE, HLA-F, and SELL in MDA-MB-231 and Hs578T cells stably expressing pCDH, Flag-CDYL2a, or Flag-CDYL2b. (F) qPCR analysis of the expression levels of HPSE, HLA-F, and SELL in BT20 and MCF-7 cells stably expressing shNC, shCDYL2 #1, or shCDYL2 #5. *, ** and ***, are significant differences at p<0.05, p<0.01, and p<0.001 levels, respectively.

