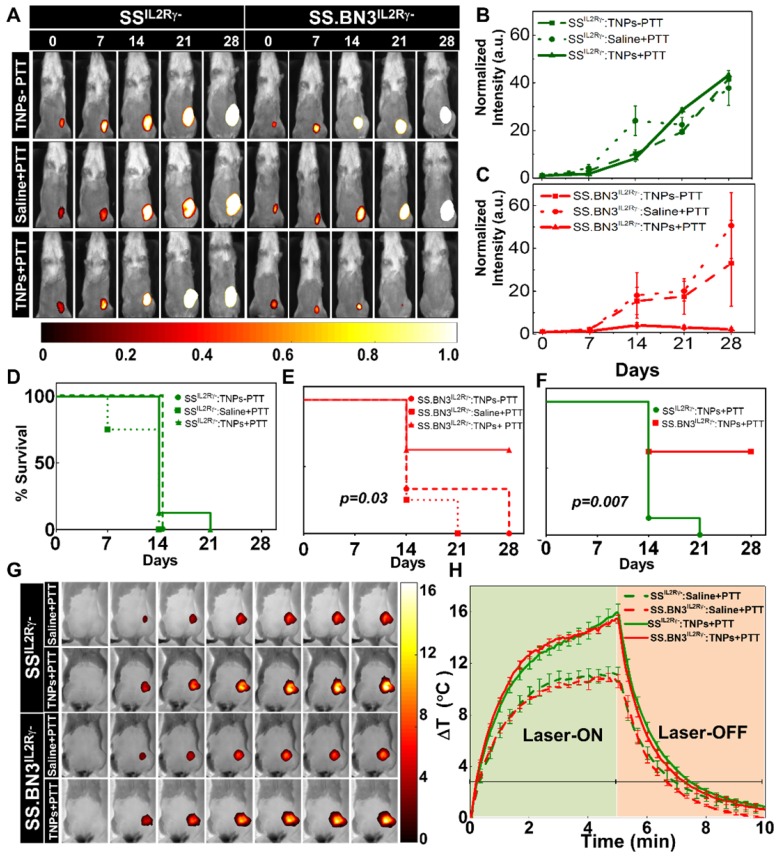
Figure 3.
Evaluation of tumor response to photothermal therapy by bioluminescence imaging and Temperature kinetics during photothermal therapy (A) Representative images of saline and TNPs treated SSIL2Rγ- and SS.BN3IL2Rγ- rats. Saline and laser treated SSIL2Rγ- (n=4) and SS.BN3IL2Rγ-(n=4) rats experienced a continuous increase. TNPs injected SSIL2Rγ-(n=4) and SS.BN3IL2Rγ- (n=4) rats without laser treatment experienced a continuous increase of bioluminescence. SSIL2Rγ- (n=8) rats experienced an increase in bioluminescence while SS.BN3IL2Rγ- (n=8) rats experienced complete loss of tumor when treated with laser. Rats were followed for 4 weeks after treatment. The luciferase signal in all groups of (B) SSIL2Rγ- and (C) SS.BN3IL2Rγ-rats was normalized to the signal before treatment. Survival curves of tumor-bearing (D) SSIL2Rγ- and (E) SS.BN3IL2Rγ- treated with TNPs only and saline solution or TNPs followed by 808-nm NIR laser irradiation for 5 min with 1.65 W/cm2 laser power covering ~2 cm2 areas. SS.BN3IL2Rγ- rats treated with TNPs and laser responded better, and trend difference was statistically significant (P = 0.03, Wilcoxon Test). (F) Survival curves of tumor-bearing SSIL2Rγ- and SS.BN3IL2Rγ- treated with TNPs and laser vary significantly (P = 0.007, Wilcoxon Test). (G) FLIR thermal images of 231LUC+ implanted SSIL2Rγ- and SS.BN3IL2Rγ- rats acquired after 24 h of saline and TNPs systemic injection, irradiated by an 808-nm NIR laser for 5 min with ~1.65 W/cm2 laser power covering ~2 cm2 areas and its temperature kinetics is depicted in (H) followed by cooling for 5 min. Temperature change (ΔT) is calculated by subtracting the surface temperature at the starting time point (37°C). All the data are shown as the mean±s.e.

