Figure 3.
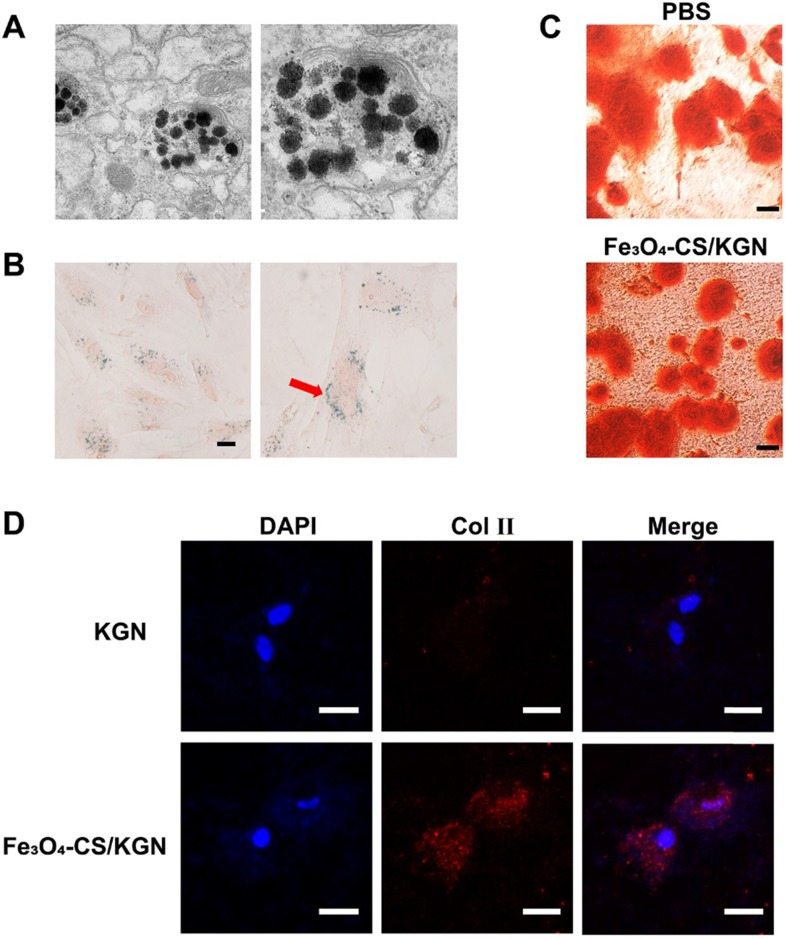
Intracellular distribution and stimulating differentiations of ADSCs. A) the TEM images of Fe3O4-CS /KGN inside the lysosomes of ADSC (24 h); B) Prussian Blue staining images for the distribution of Fe3O4-CS /KGN after 24 h (scale bars is 20 µm); C) the osteogenic stimulating differentiation with PBS or Fe3O4-CS /KGN in vitro (4 weeks, Alizarin Red S staining, scale bar is 20 µm); D) the type 2 collagen immunofluorescent images of induced ADSCs by 10 µM KGN or Fe3O4-CS /KGN in vitro (2 weeks). All scale bars are 20 µm.

