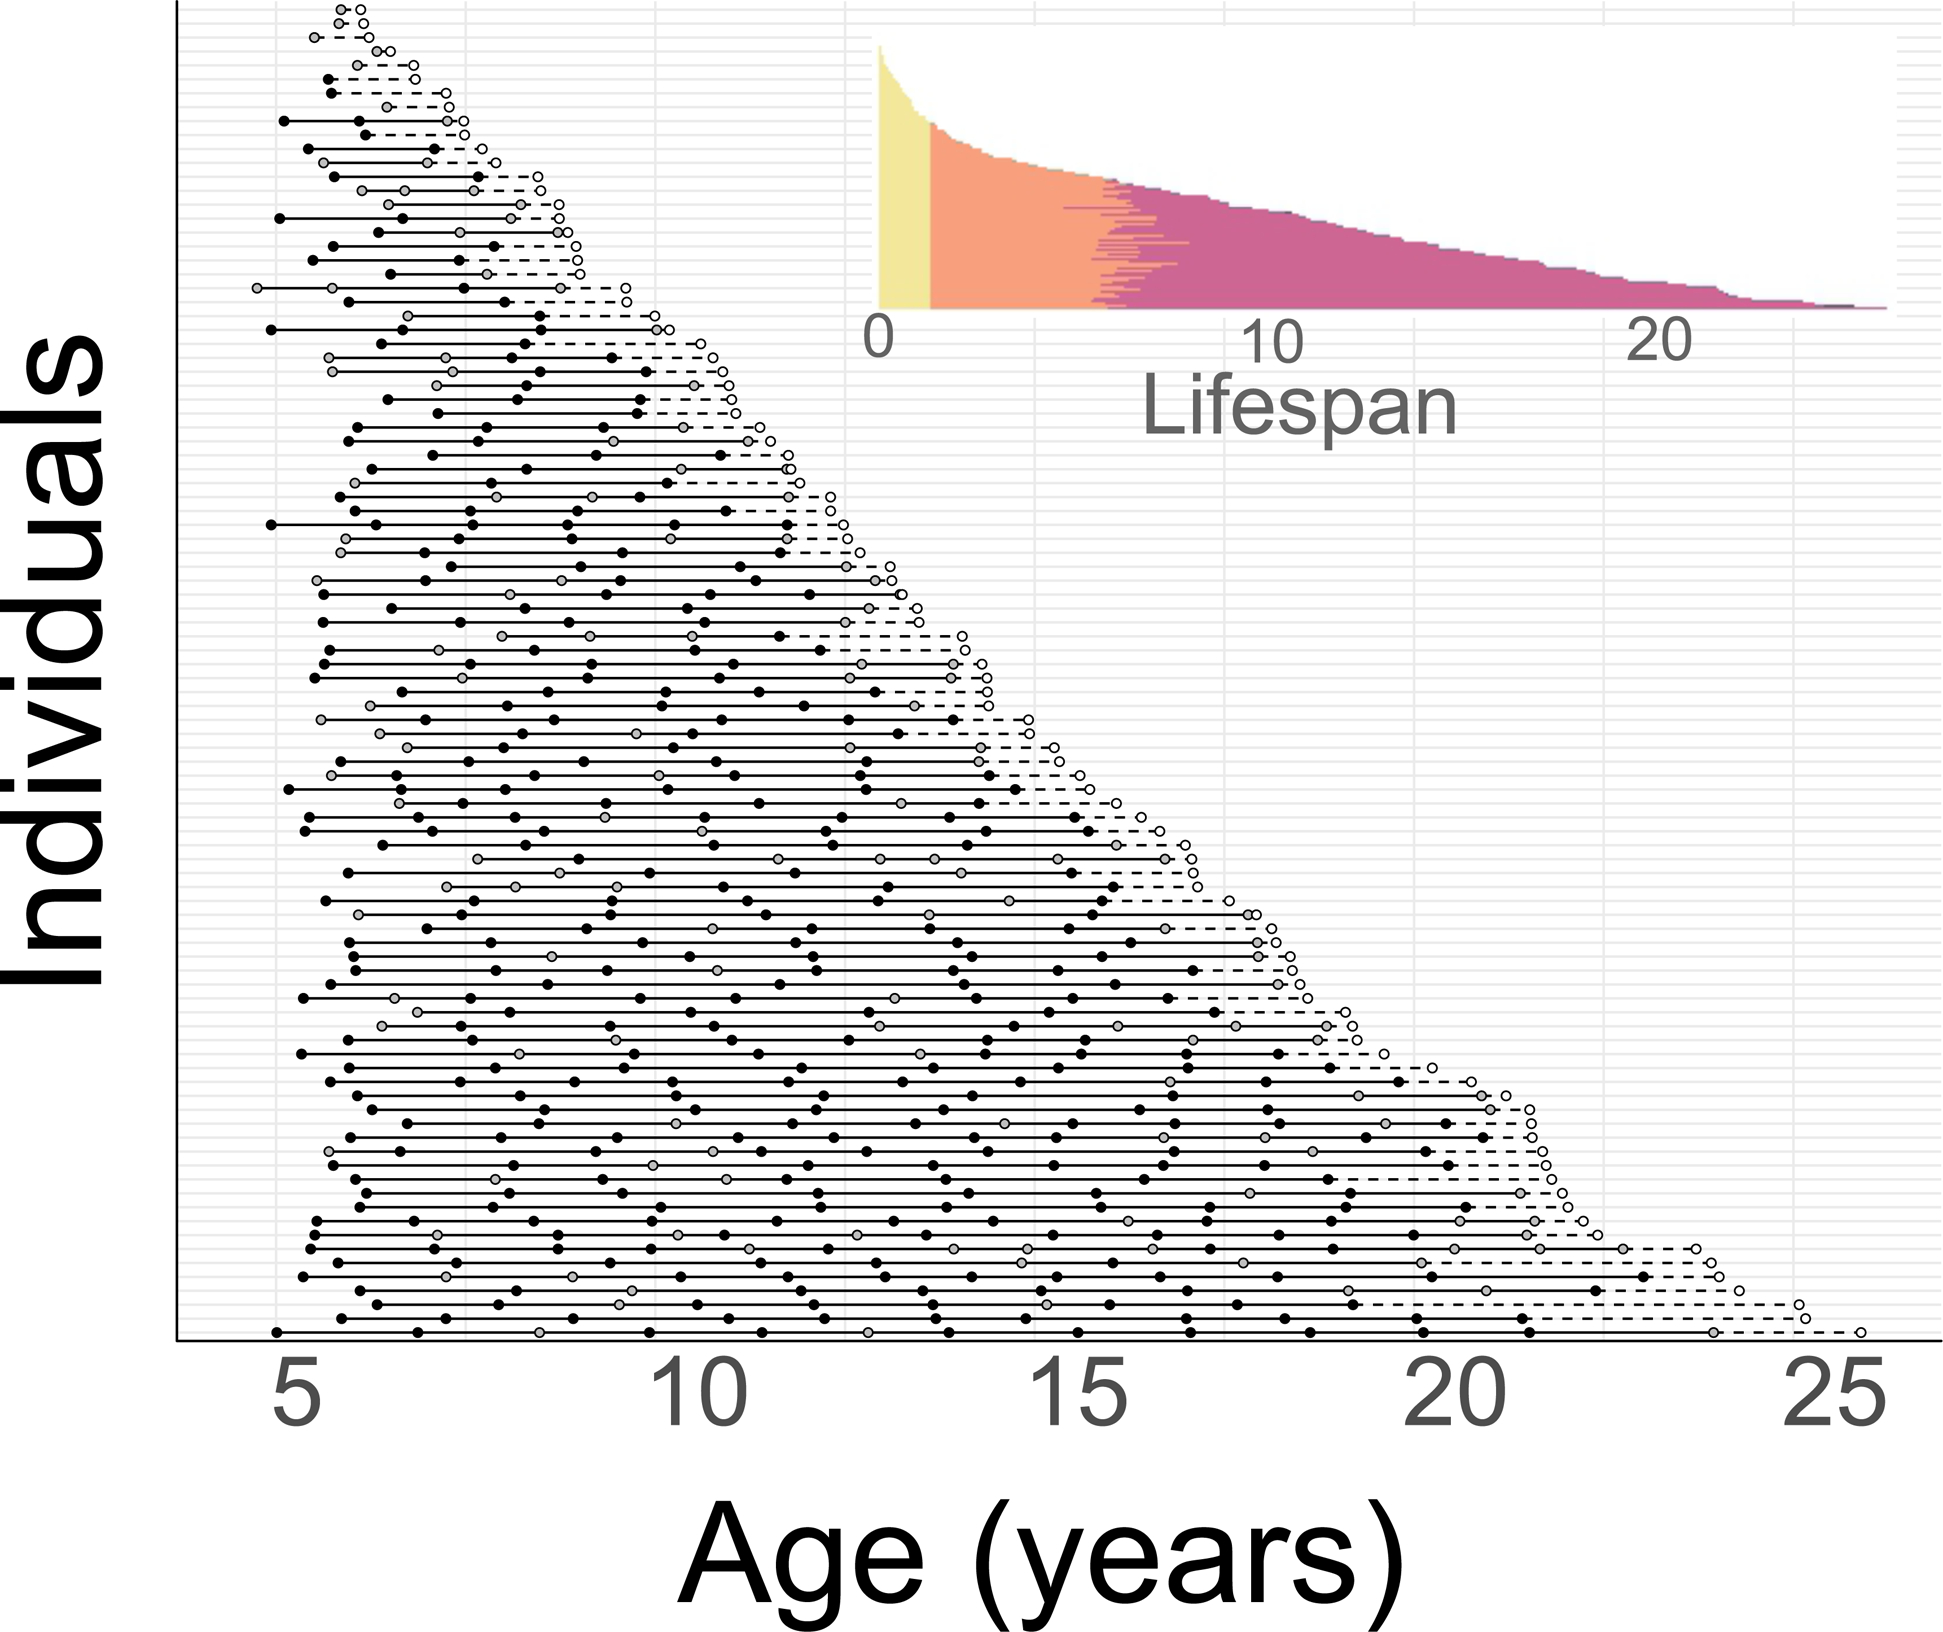
Figure 1.

Visualization of complete female life histories. The main panel includes only females that experienced at least one live birth (N=96). Each line represents a distinct female, and each filled dot represents a live birth; black dots represent offspring who survived to weaning age, gray dots represent offspring who died before the average age of weaning in our population. Solid black line segments represent interbirth intervals (some of which represent live interbirth intervals, and some surviving interbirth intervals: see text and Table S2). Open dots indicate the female’s age at death and dashed lines represent the time between her last birth and death. The inset panel shows all females in the dataset, including those who died without reproducing (N=199). Infancy (to average weaning age) is shown in yellow, the juvenile period (between weaning and age at first reproduction) in orange, the reproductive period in magenta, and post reproductive life in dark purple (considered to begin 915 days after a female’s last live birth; i.e., the mean live interbirth interval plus 2 standard deviations).
