
Figure 4.
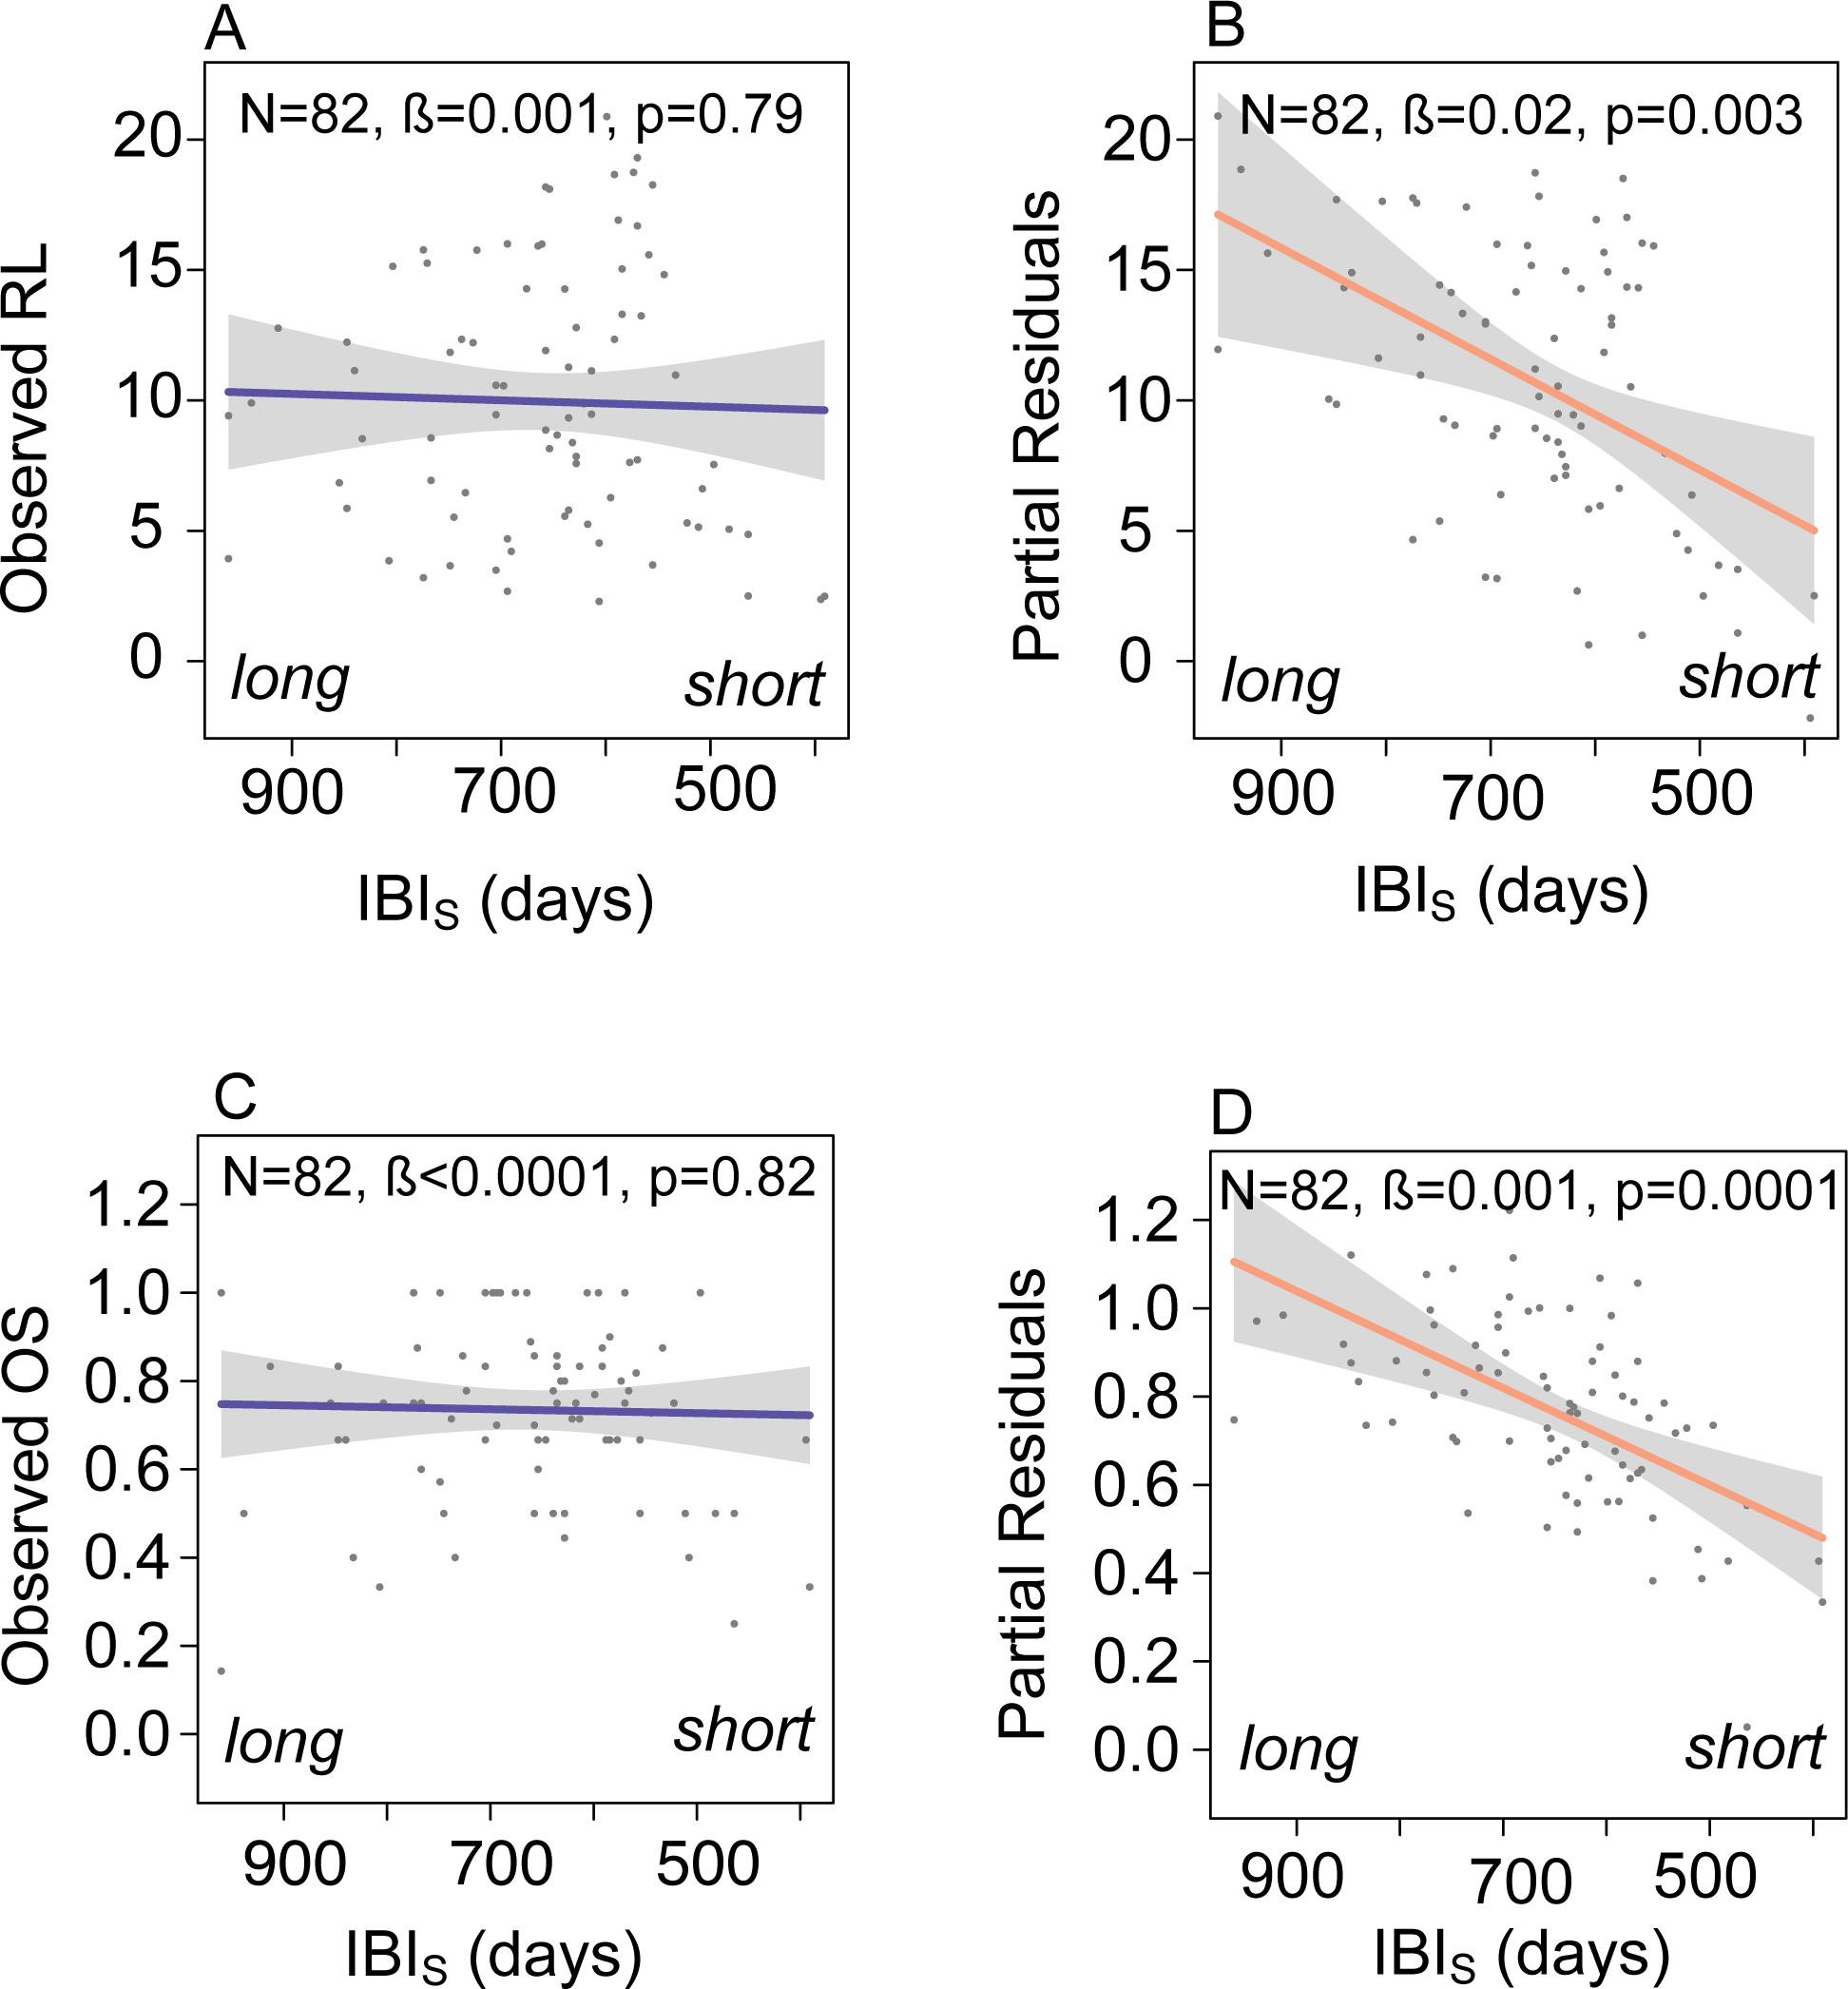
Survival and reproductive costs of reproduction are apparent after accounting for individual heterogeneity in quality. (A) The observed population-level relationship between surviving interbirth interval (IBIS) and reproductive lifespan (RL). (B) The population-level relationship between surviving interbirth interval and reproductive lifespan after accounting for variation in phenotypic quality. The points in (B) represent the partial residuals from a regression of our quality metric (i.e., PC1) against reproductive lifespan, plotted as a function of surviving interbirth interval (i.e., the average length of time between the birth of an offspring who survived infancy and the mother’s next live birth). (C) The observed population-level relationship between surviving interbirth interval (IBIS) and proportion offspring surviving (OS). (D) The population-level relationship between surviving interbirth interval and proportion offspring surviving after accounting for variation in quality. The points in (D) represent the partial residuals from a regression of our quality metric (i.e., PC1) against proportion offspring surviving, plotted as a function of surviving interbirth interval.