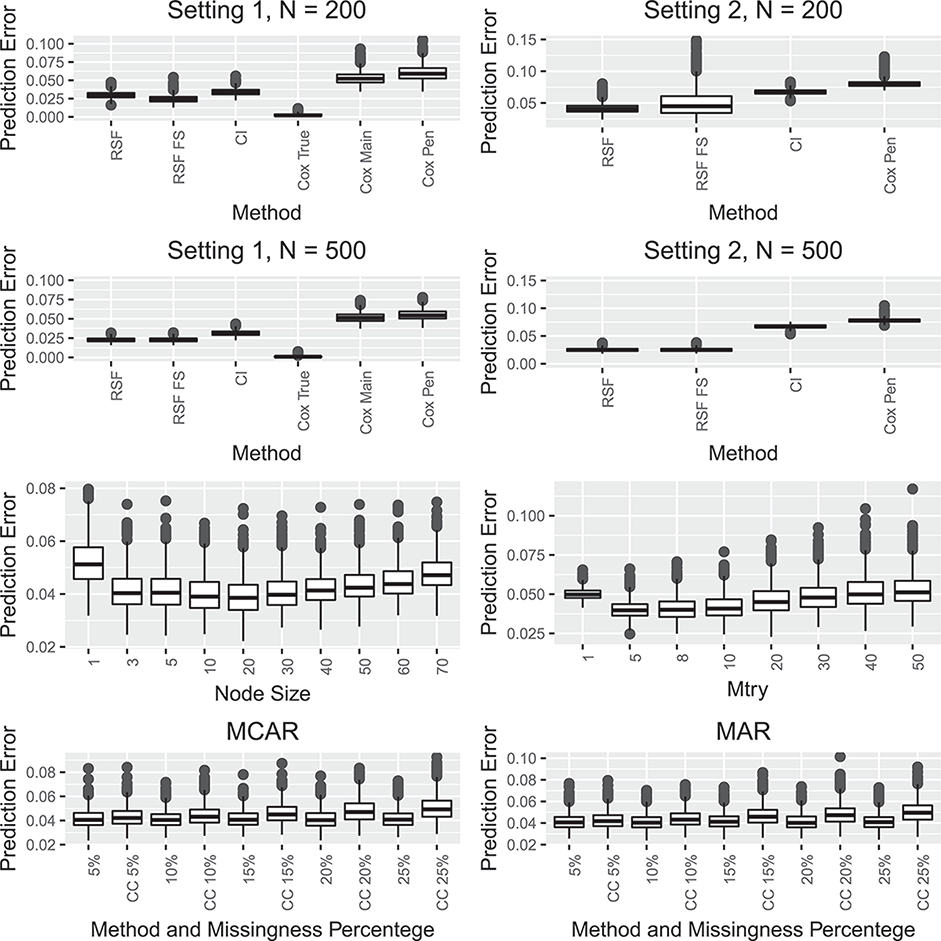
Figure 7:
The first two rows shows simulation results comparing prediction error for random survival forests (RSF), random survival forests with feature selection (RSF FS), conditional inference forests (CI), and a penalized cox model (Cox Pen) in two settings described in Section 6. The first row shows the results when the sample size is 200 and the second row for the sample size 500. For the first setting Cox True and Cox Main refer to the true underlying Cox model and a Cox model that includes the correct main effects. The third row shows the impact of the choice of the tuning parameters mtry and node size on the prediction error for the random survival forest algorithm. The fourth row shows the impact of missing data on the prediction error for the random survival forest algorithm both when the missing is completely at random and when the missingness is at random.

