Figure 2.
Effect of nano-copper on morphological and pathological changes in mice
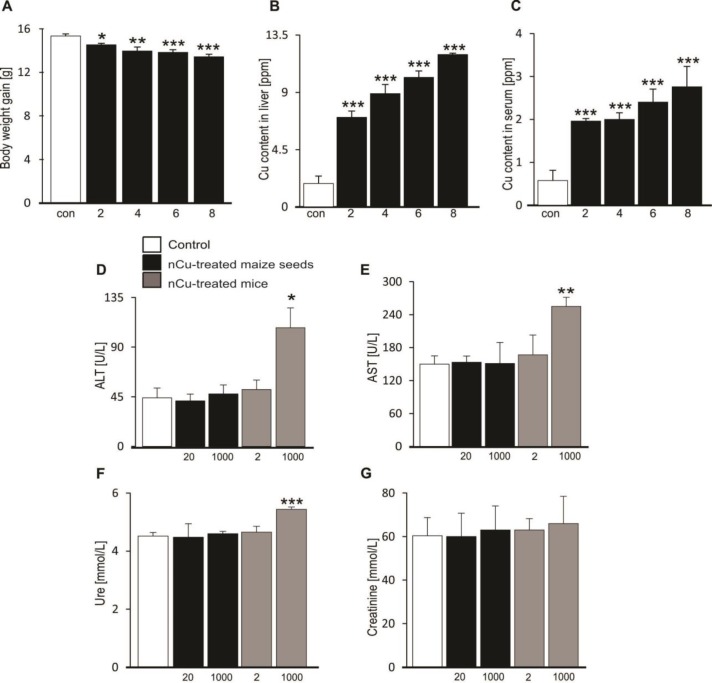
A. Arithmetic means (n=4-5) of body weight gain in mice, which were left untreated (control, white bar) or treated with 1000 mg/l nCu (black bar) for indicated time intervals (2, 4, 6 and 8 weeks). * (P<0.05), ** (P<0.01) and *** (P<0.001) represent significant differences from control group, ANOVA
B-C. Arithmetic means (n=4-5) of Cu content in liver (B) and serum (C) of mice, which were left untreated (control, white bar) or treated with 1000 mg/l nCu (black bar) for indicated time intervals (2, 4, 6 and 8 weeks). *** (P<0.001) represents significant difference from control group, ANOVA.
D-G. Arithmetic means (n=4-5) of serum alanine transaminase (ALT) (D), aspartate transaminase (AST) (E), urea (F) and creatinine (G) concentrations in mice, which were left untreated (control, white bars) or fed with grain maize derived from 20 mg/kg dry weight (DW) or 1000 mg/kg DW nCu-treated seeds (black bars) or treated with nCu at dose of 2 mg/l or 1000 mg/l (grey bars). * (P<0.05), ** (P<0.01) and *** (P<0.001) represent significant differences from control group, ANOVA

