Figure 3.
Effect of nano-copper on immune cell infiltration into mouse spleens
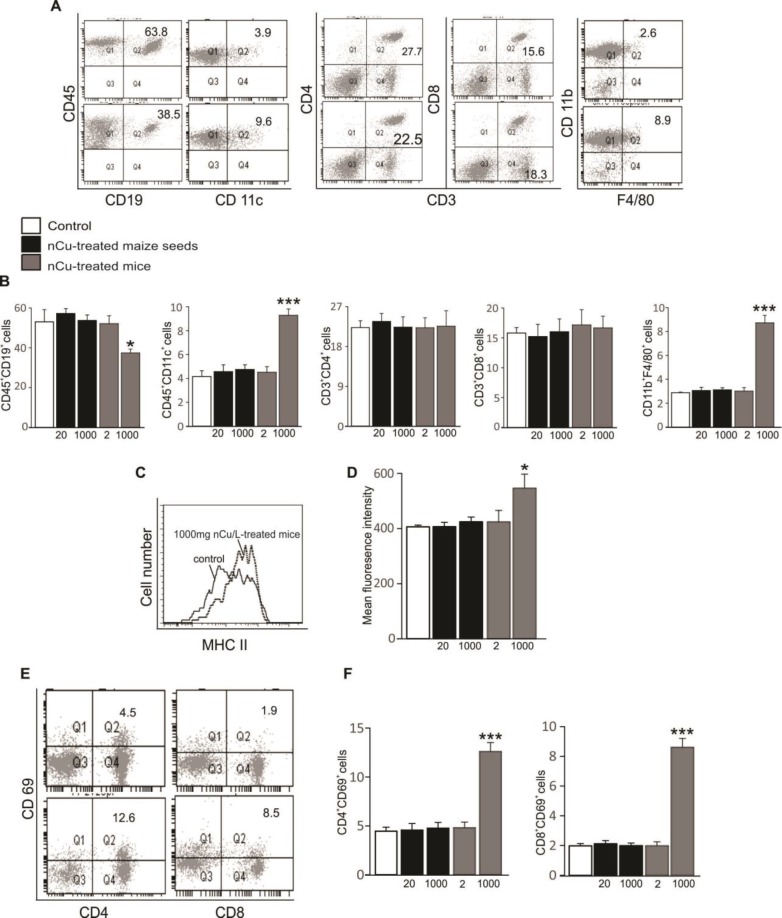
A. Original dot plots of CD45+CD19+, CD45+CD11c+, CD45+CD3+ CD4+, CD45+CD3+ CD8+ and CD45+CD11b+ F4/80+ cells recruited to spleens of mice, which were untreated (control, upper panels) and treated with 1000 mg/l nCu (lower panels). Numbers depict the percent of cells in the respective quadrants, acquired within the dead cell gate
B. Arithmetic means (n=4-5) of percentages of CD45+CD19+, CD45+CD11c+, CD45+CD3+ CD4+, CD45+CD3+ CD8+ and CD45+CD11b+ F4/80+ cells recruited to spleens of mice, which were left untreated (control, white bars) or fed with grain maize derived from 20 mg/kg dry weight (DW) or 1000 mg/kg DW nCu-treated seeds (black bars) or treated with nCu at dose of 2 mg/l or 1000 mg/l (grey bars). * (P<0.05) and *** (P<0.001) represent significant differences from control group, ANOVA
C. Histogram of major histocompatibility complex (MHC) class II expression was obtained by FACS analysis in a representative experiment on control (solid line) and 1000 mg nCu/l-treated splenic leukocytes (dotted line)
D. Arithmetic means ± SEM (n=5) of mean fluorescence intensity (MFI) of splenic leukocytes in mice, which were left untreated (control, white bars) or fed with grain maize derived from 20 mg/kg DW or 1000 mg/kg DW nCu-treated seeds (black bars) or treated with nCu at dose of 2 mg/l or 1000 mg/l (grey bars). * (P<0.05) represents significant difference from control group, ANOVA
E. Original dot plots of CD45+CD4+ CD69+ and CD45+CD8+ CD69+ cells recruited to spleens of mice, which were untreated (control, upper panels) and treated with 1000 mg/l nCu (lower panels). Numbers depict the percent of cells in the respective quadrants, acquired within the dead cell gate
F. Arithmetic means (n=5) of percentages of CD45+CD4+ CD69+ and CD45+CD8+ CD69+ cells recruited to spleens of mice, which were left untreated (control, white bars) or fed with grain maize derived from 20 mg/kg DW or 1000 mg/kg DW nCu-treated seeds (black bars) or treated with nCu at dose of 2 mg/l or 1000 mg/l (grey bars). *** (P<0.001) represents significant difference from control group, ANOVA

