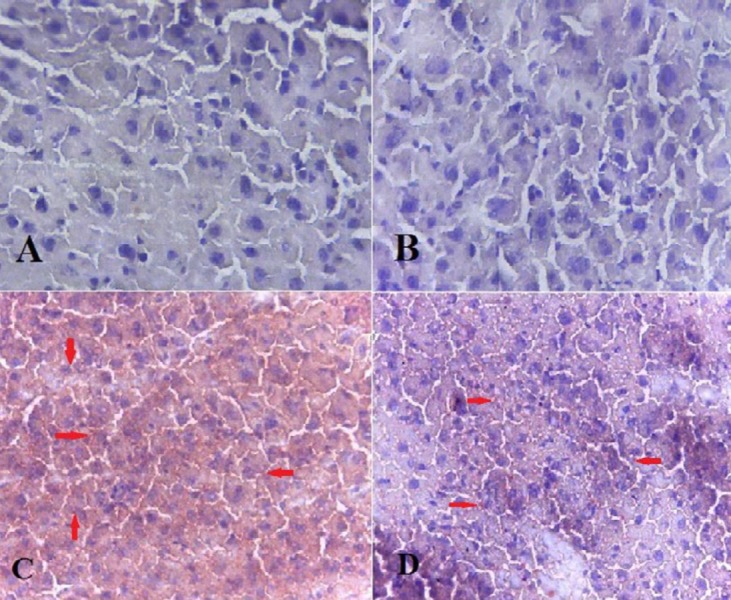
Figure 2.
Histological findings of liver tissues after Oil red O staining (magnification; ×200) in different experimental groups. A; Control group: Normal liver histology, B; Allantoin group: Normal liver histology, C; NASH group: showing steatosis (red spots), D; NASH + allantoin group: showing lower steatosis (red spots)

NASH: Non-alcoholic steatohepatitis
