
Figure 4.
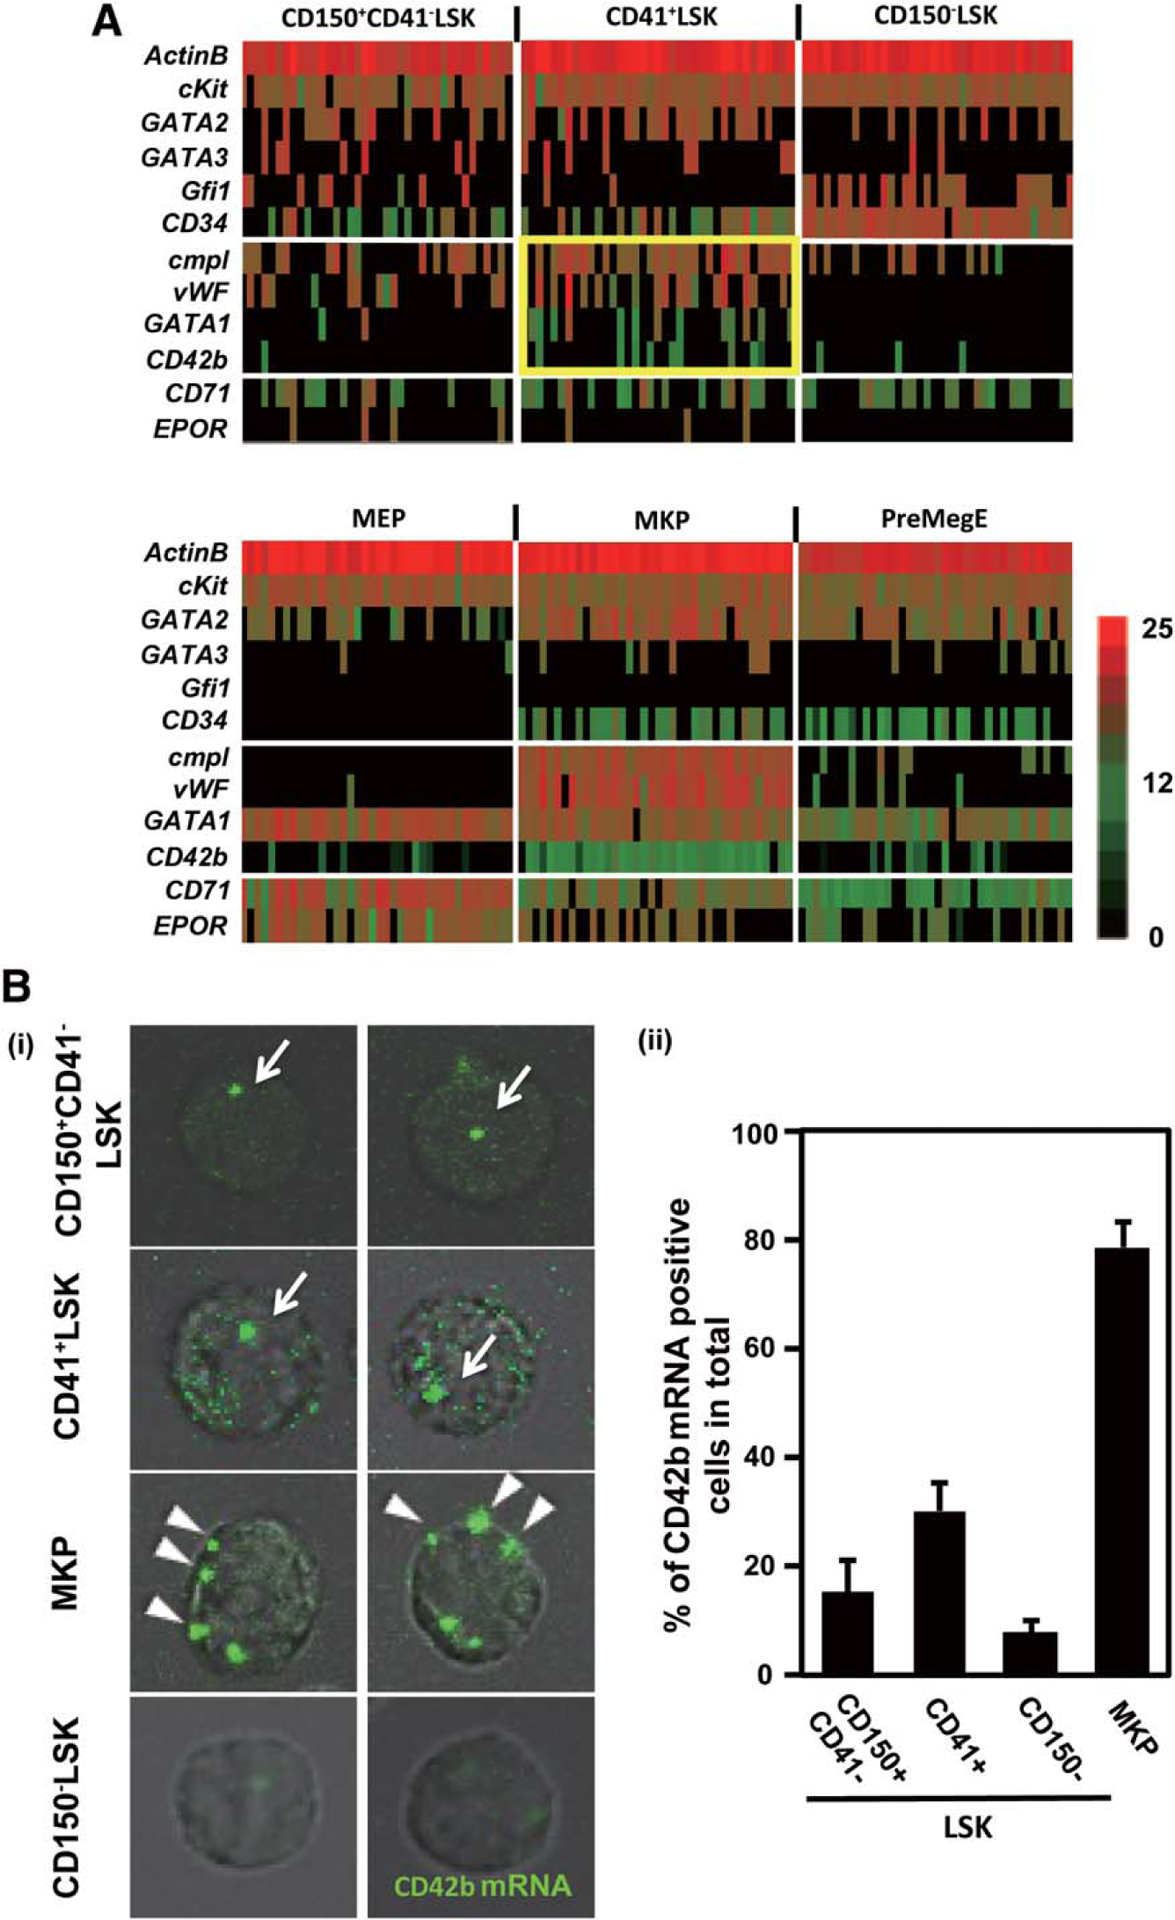
A single cell gene expression revealed the proximity between a subpopulation of CD41+LSK and MKP. (A):Single cell gene expression. Single cell real-time polymerase chain reaction was applied to analyze gene expression in single cells constituting CD150+CD41−LSK, CD41+LSK, CD150−LSK, megakaryocyte–erythroid progenitor, MKP, and PreMegE. Expression of 11 genes in 38 representative cells from each population was shown. The levels of transcripts in individual cells quantified by cycle threshold values and shown by colors indicated (red, highest; black, lowest). Note that cMpl, vWF, and CD42b were densely expressed in MKP, and that the closest pattern is observed in CD411LSK (yellow gate). (B): CD42b mRNA imaging at a single cell level. Sorted CD150+CD41−LSK, CD41+LSK, MKP, and CD150−CD41−LSK from wild type bone marrow are fixed on the poly-L-lysine coated glass slides and stained with a CD42b mRNA specific probe. Typical single cell images were shown in (i), green signals, CD42b mRNA. arrow, nuclear-localized CD42b mRNA; arrowhead, cytoplasm-localized CD42b mRNA. The frequencies of CD42b mRNA-positive cells in each progenitor population are shown in (ii). Each graph shows the result of three independent experiments. Abbreviations: LSK, lineage−Sca1+cKit+; MEP, megakaryocyte–erythroid progenitor; MKP, megakaryocytic progenitor; PreMegE, pre-megakaryocyte/erythrocyte progenitors.