
Figure 6.
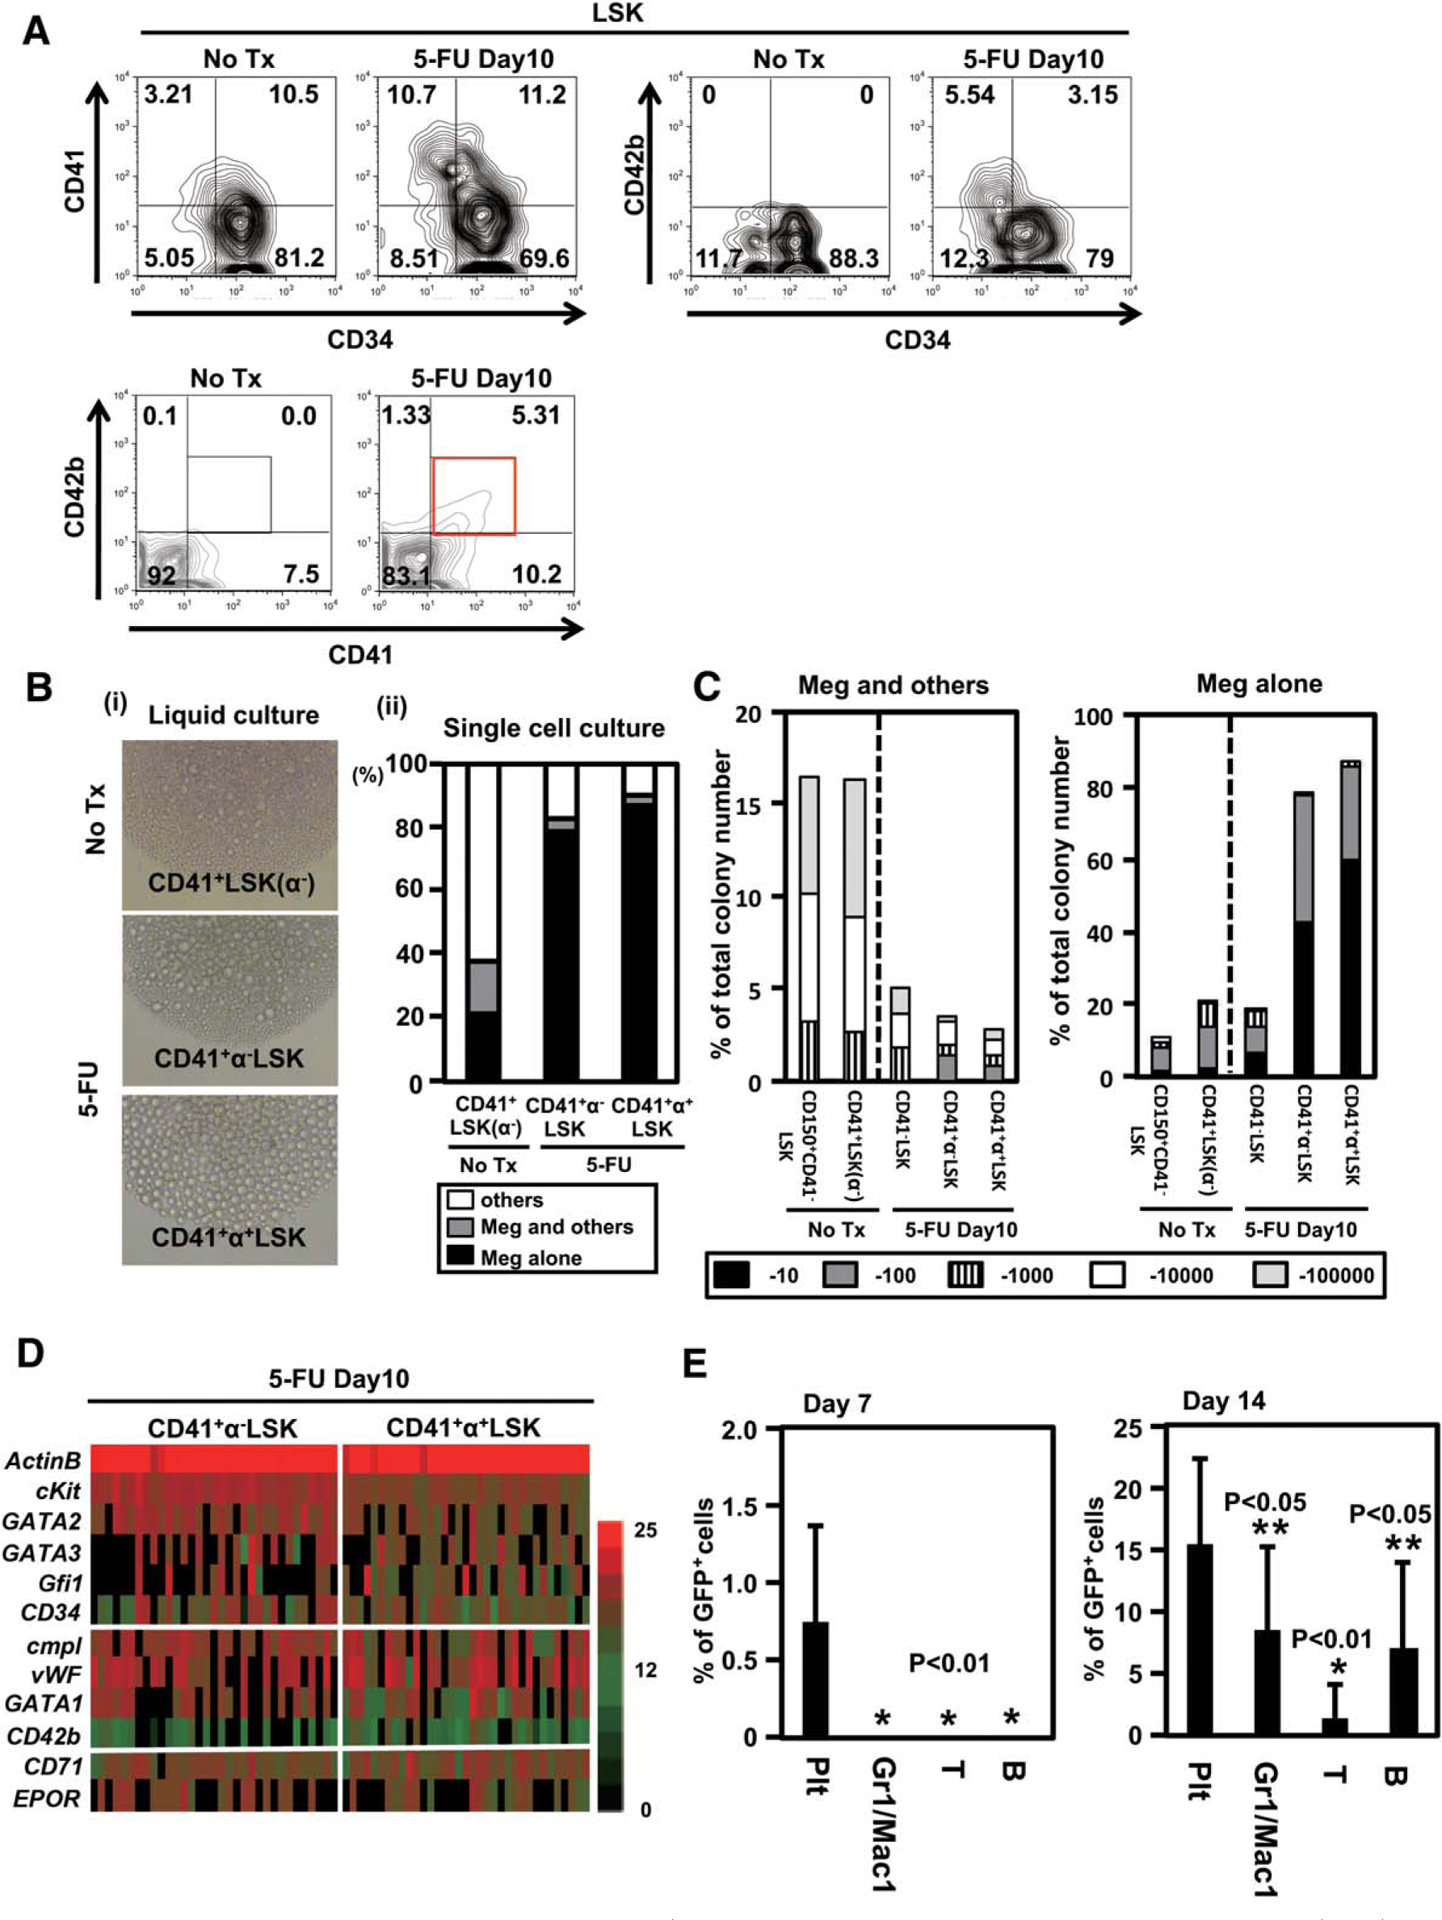
Emergency megakaryopoiesis is driven at the CD41+LSK stage. (A): Expression of CD42b in lineage−Sca1+cKit+ (LSK) compartment during the recovery phase after 5-FU treatment. Expression of CD42b in LSK was analyzed 10 days after a single 5-FU (150 mg/kg) treatment. A representative result of CD34, CD41, and CD42b staining from five independent experiments are shown. (B): (i) Sorted 500 CD41+CD42b−LSK [CD41+LSK (α−)] from untreated mice and CD41+CD42b− LSK cells (CD41+α−LSK) and CD41+CD42b+LSK (CD41+α+LSK) from 5-FU-treated mice were cultured in 96-well plates to assess their capacity for megakaryopoiesis. The pictures show representative morphologies of differentiated cells. (No Tx, no treatment). (ii) Preferential megakaryocyte differentiation from CD41+α+LSK and CD41+α−LSK after 5-FU treatment, compared with CD41+LSK (α−) at steady-state condition, assessed by single cell culture. Indicated progenitor cells were single cell-sorted into each well of 96-well dishes and cultured in the presence of stem cell factor (SCF), thrombopoietin (TPO), interleukin (IL)26, and IL-11. Colonies formed in each well were classified into those containing megakaryocytes alone, containing megakaryocytes and others, and without megakaryocytes. Three separated experiments were combined. (C): Proliferative capacity of indicated progenitors in single cell culture. Clone-sorted cells were cultured in 96 wells in the presence of TPO, SCF, IL-6, and IL-11. The frequency of cell proliferation was assessed on day 10. The numbers of megakaryocyte-containing (Meg1others, left) and megakaryocytes (Meg Alone, right) colonies were classified into five categories. (D): The results of single cell PCR using the samples from CD41+α−LSK and CD41+α+LSK from 5-FU treated mice. Expression of 11 genes in 38 representative cells from each population is shown. The levels of transcripts in individual cells are quantified by cycle threshold values and shown by indicated colors (red, highest; black, lowest). (E): Five hundred CD41+LSK from 5-FU-treated green fluorescent protein (GFP) transgenic mice were sorted and transplanted into lethally irradiated wild type mice. The frequencies of GFP+ cells in peripheral blood at very early time points are shown (n 5 10, each group). Abbreviations: GFP, green fluorescent protein; LSK, lineage−Sca1+cKit+; Meg, megakaryocyte.