
Figure 2.
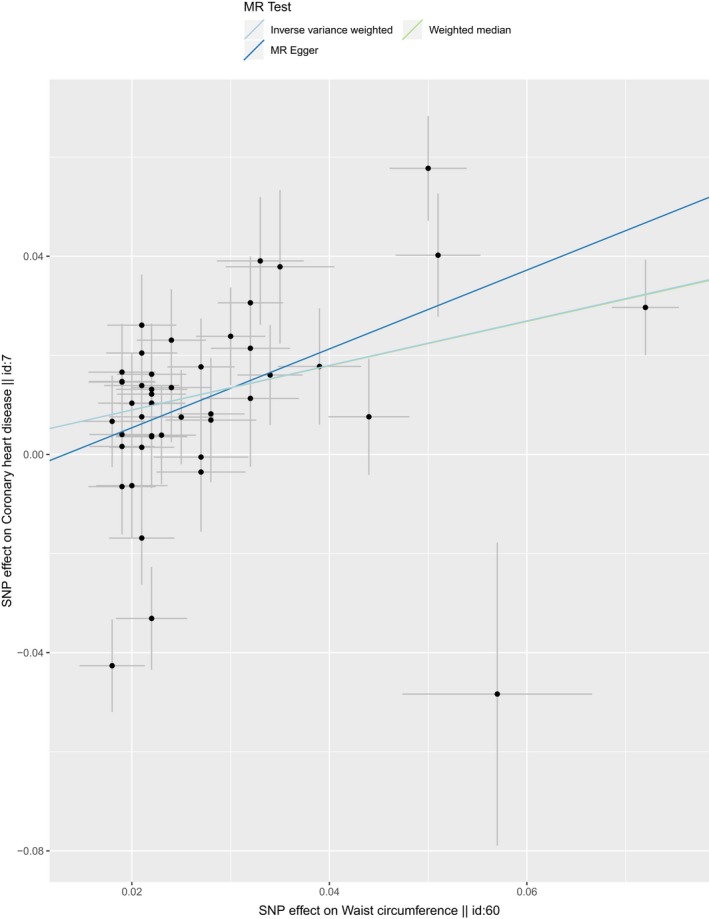
Scatter plot of SNPs associated with WC and the risk of CHD. The plot relating the effect sizes of the SNP‐LDL association (x‐axis, SD units) and the SNP‐CHD associations (y‐axis, log (OR)) with 95% confidence intervals. The regression slopes of the lines correspond to causal estimates using four of the Mendelian randomization (MR) methods. (IVW approach, MR‐Egger, and Weighted median). CHD, coronary heart disease; IVW, inverse‐variance weighted; SNP, single‐nucleotide polymorphism; WC, waist circumference