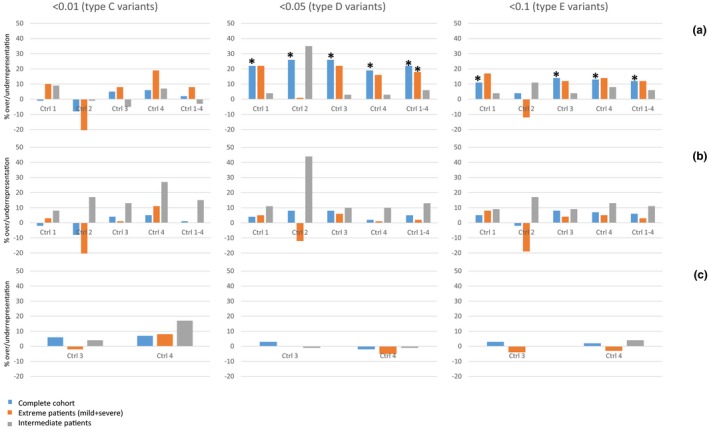
Figure 1.

Overrepresentation of variants in epilepsy genes in the cohort. Bars represent the percentage of over‐ or underrepresentation of variants in the different patient groups, based on the ratio of variants found in epilepsy genes and different control groups (ctrl 1, 2, 3, 4 and 1–4), compared to ratios in the ExAC database. (a) Variants in epilepsy genes compared to different control groups; (b) variants in intellectual disability genes compared to different control groups; (c) variants in control group 1 genes compared to control group 3 and 4 (negative control). Results are presented for categories of variants with different allele frequency cut‐offs (<0.01, <0.05, <0.1). Significant values are depicted by asterisks
