
Figure 5.
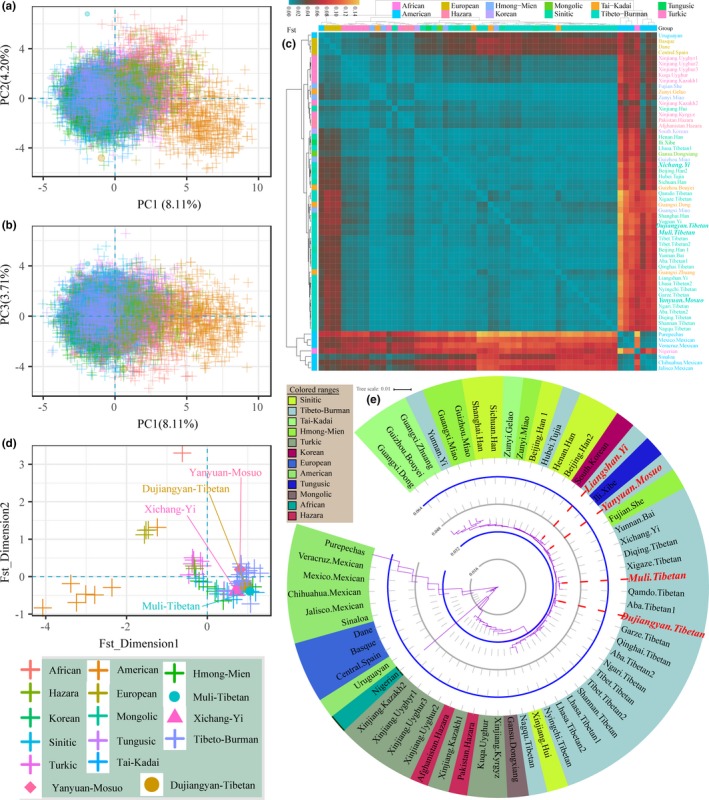
Comprehensive population comparisons based on raw genotype data of 60 populations. (a,b) Principal component analysis of individual samples among 60 populations. (c) Heat map of pairwise Fst genetic distances among 60 populations. (d) Multidimensional scaling analysis among 60 populations on the basis of Fst genetic distances. (e) Phylogenetic tree among 60 populations residing in different continents and belonging to diverse languages families