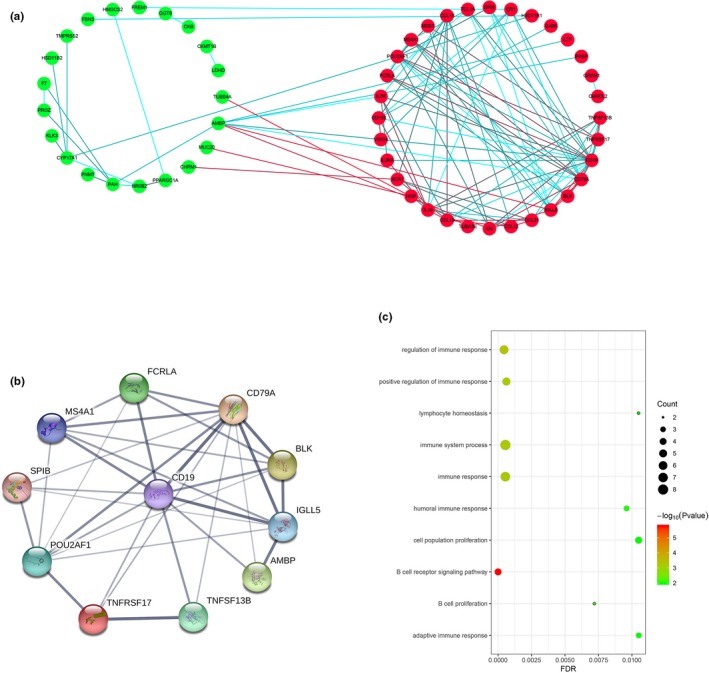
Figure 8.

Constructed PPI network of DEGs and analysis of module. (a) PPI network of DEGs; red nodes represent upregulated DEGs and green nodes represent downregulated DEGs. The blue and red lines indicate the combined score from low to high. (b) The most important module; (c) biological process of all genes in the most important module
