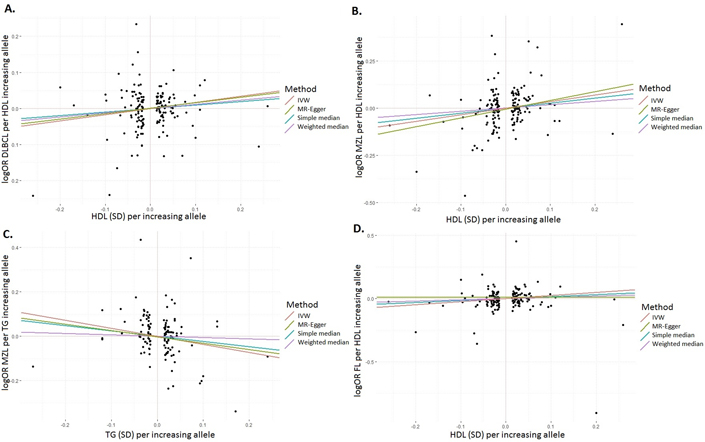
Figure 1: HDL and TC SNP-specific effects for risk of lymphoma subtypes.

Scatter plots for lipid traits and lymphoma associations for SNPs and four MR estimates (IVW, MR-Egger, simple median, and weighted median): (A) HDL and DLBCL association; (B) HDL and MZL association; (C) TG and MZL association; (D) HDL and FL association; DLBCL, diffuse large B-cell lymphoma; MZL, marginal zone lymphoma; FL, follicular lymphoma; HDL, high-density lipoprotein; TG, triglyceride; SD, standard error; SNP, single nucleotide polymorphism; MR, mendelian randomization; IVW, inverse-variance weighted
