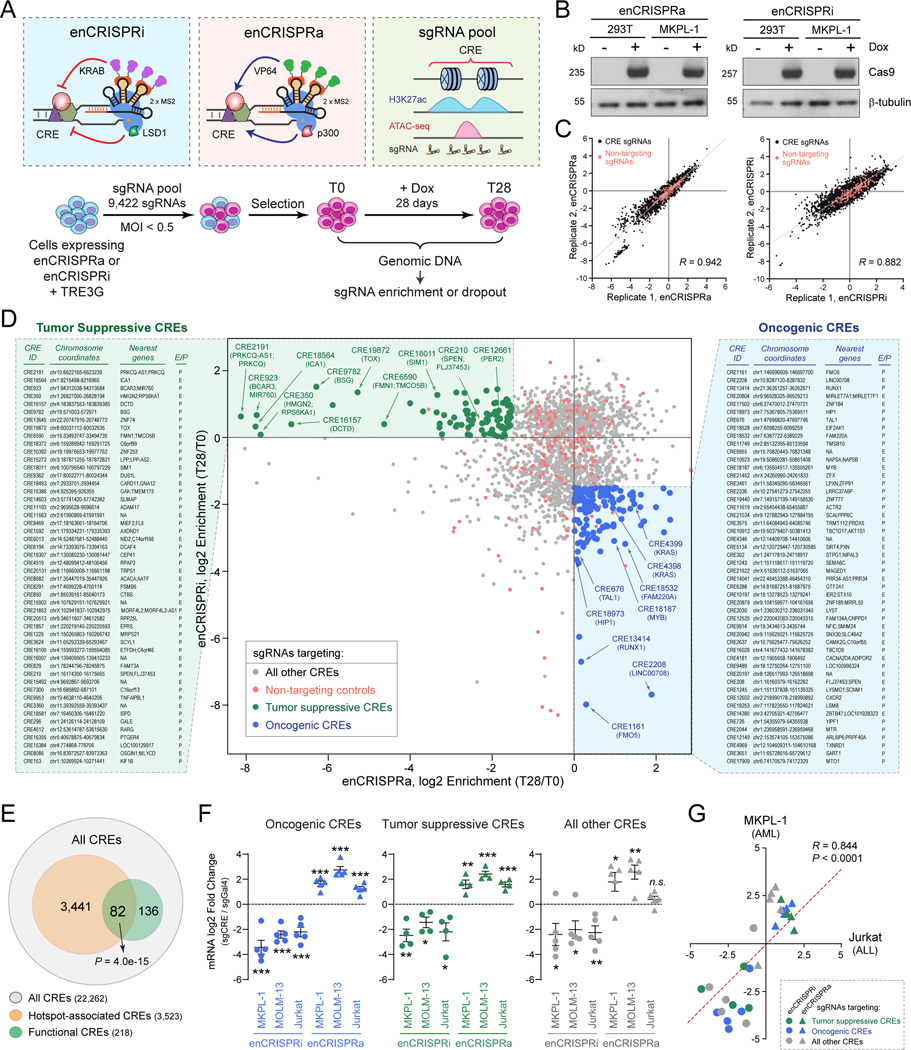
Figure 2. Identification of tumor suppressive and oncogenic CREs by perturbation screens.
(A) Schematic of CRE perturbation screens by enCRISPRi and enCRISPRa epigenetic editing.
(B) Validation of Dox-inducible expression of dCas9-p300 and dCas9-LSD1 proteins in 293T and MKPL-1 stable cell lines by Western blot. β-tubulin was analyzed as a loading control.
(C) Validation of CRE perturbation screens by replicate experiments. CRE-specific sgRNAs (black) and non-targeting control sgRNAs (red) are shown. The x- and y-axis denote the normalized log2 fold changes of sgRNA enrichment or dropout in T28 relative to T0 samples. The Pearson correlation coefficient (R) values are shown.
(D) CRE perturbation screens by enCRISPRa and enCRISPRi identified candidate tumor suppressive and oncogenic CREs in human leukemia. Scatter plot is shown for each CRE or control sgRNA ranked by the log2 fold changes of sgRNA enrichment or dropout in T28 relative to T0 samples by enCRISPRa (x-axis) and enCRISPRi (y-axis) screens. Dots represent sgRNA-targeted top candidate tumor suppressive CREs (green), top candidate oncogenic CREs (blue), all other CREs (grey) or non-targeting controls (red). The CRE ID, chromosome coordinates, enhancer nearest neighbor genes (up to two genes within 50kb) or promoter-associated genes, and annotations (E: enhancer; P: promoter) for the top 50 candidate tumor suppressive (left) or oncogenic CREs (right) are shown. The complete lists are shown in Table S7.
(E) Non-coding mutational hotspots are enriched with functional CREs. Venn diagram shows the overlap between all CREs (22,262), the mutational hotspot-containing CREs (3,523 CREs for 4,076 mutational spots) and the functional CREs identified from enCRISPRi and enCRISPRa screens (218). P value was calculated using hypergeometric distribution.
(F) Validation of enCRISPRi and enCRISPRa-mediated CRE perturbations in AML (MKPL-1 and MOLM13) and ALL (Jurkat) cells. Dot plots are shown for the log2 fold changes of mRNA expression of CRE-associated genes in enCRISPRi or enCRISPRa expressing cells with CRE-specific (sgCRE) or non-targeting (sgGal4) sgRNAs, respectively. Results are mean ± SEM (N = 4 or 5 CRE-associated genes) and analyzed by a two-sided student’s t-test. *P < 0.05, **P < 0.01, ***P < 0.001, n.s. not significant. The individual data points for each CRE are shown in Fig. S7.
(G) enCRISPRi and enCRISPRa-mediated CRE perturbations modulated target gene expression in both AML and ALL cells. Scatter plots are shown for mRNA expression of CRE-associated genes in MKPL-1 AML (y-axis) and Jurkat ALL (x-axis) cells upon enCRISPRi (circle dots) or enCRISPRa (triangle dots) perturbations with sgRNAs for tumor suppressive (green), oncogenic (blue) or other CREs (grey). The x- and y-axis denote the log2 fold changes of mRNA expression of CRE-associated genes in cells with CRE-specific sgRNAs relative to the non-targeting (sgGal4) control, respectively. The Pearson correlation coefficient (R) value is shown. Two-tailed P value with confidence internal 95% is shown.

