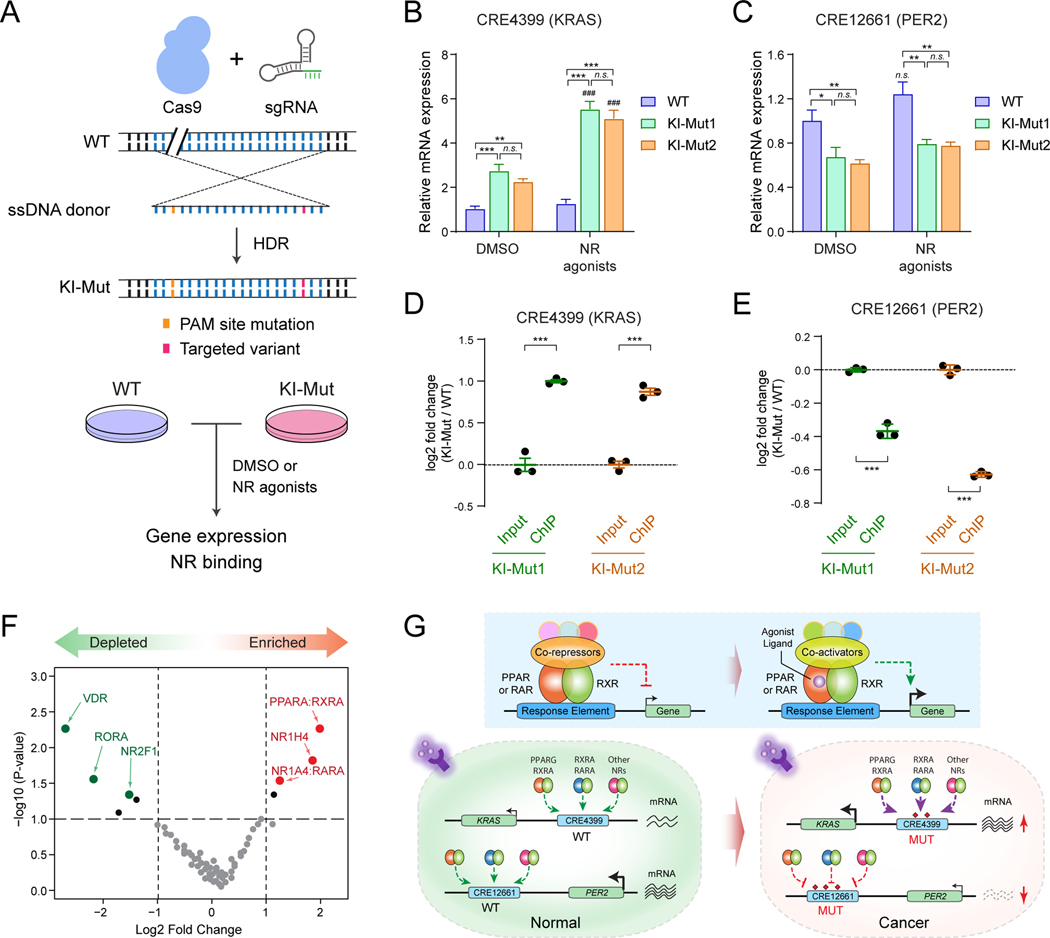
Figure 6. Non-coding variants connect enhancer dysfunction with nuclear receptor signaling in leukemia.
(A) Schematic of site-specific KI of KRAS or PER2 non-coding variant to the endogenous enhancer sequences. Unmodified (WT) and validated single-cell-derived KI-Mut cells were treated with DMSO or NR agonists, followed by analysis of gene expression and NR binding.
(B) KI of KRAS (CRE4399) enhancer variant increased KRAS expression upon activation of RXR and PPARG signaling in K562 cells. Results are mean ± SEM of 4 independent experiments. The differences between control (DMSO) and two single-cell-derived KI cell lines (KI-Mut1 and KI-Mut2) were analyzed by a two-way ANOVA with Turkey correction for multiple comparisons. **P < 0.01, ***P < 0.001, n.s. not significant. The differences between DMSO and NR agonist-treated groups were analyzed by a two-way ANOVA. ###P < 0.001.
(C) KI of PER2 (CRE12661) enhancer variant decreased PER2 expression upon activation of RXR and PPARG signaling in K562 cells. Results are mean ± SEM of 4 independent experiments, and analyzed by a two-way ANOVA. *P < 0.05, **P < 0.01, n.s. not significant.
(D) KI of KRAS (CRE4399) enhancer variant increased PPARG/RXRA binding to the KRAS KI-Mut enhancer allele in K562 cells. The y-axis shows the log2 fold change of ChIP signals (normalized read counts) at the KI-Mut vs WT alleles in input (control) and ChIP samples. Results are mean ± SEM of 3 independent experiments. The differences between control (input) and ChIP samples in two single-cell-derived KI cell lines (KI-Mut1 and KI-Mut2 indicated as green and orange colors) were analyzed by a student’s t-test. ***P < 0.001.
(E) KI of PER2 (CRE12661) enhancer variant decreased PPARG/RXRA binding to the PER2 KI-Mut enhancer allele in K562 cells. The y-axis shows the log2 fold change of ChIP signals at the KI-Mut vs WT alleles in input and ChIP samples. Results are mean ± SEM of 3 independent experiments.
(F) PPAR and RXR are the top enriched NR motifs at the functionally validated oncogenic CREs from enCRISPRi and enCRISPRa screens. The y-axis shows the negative log10 of P values calculated by hypergeometric distribution. The x-axis shows the log2 fold changes of motif enrichment scores relative to random control regions. The significantly enriched or depleted NR motifs (P ≤ 1×10⁻⁴) are indicated by red and green data points, respectively.
(G) Models for the cooperation between non-coding variants, enhancer dysregulation and NR signaling. The schematic of ligand-dependent transcriptional regulation by NRs is also shown. PPAR and RAR proteins function as obligate heterodimers with RXRs in the absence of ligands and bind to hormone response elements together with corepressor proteins. Binding of agonist ligands leads to dissociation of corepressors and recruitment of coactivator proteins, resulting in transcriptional activation of downstream target genes.

