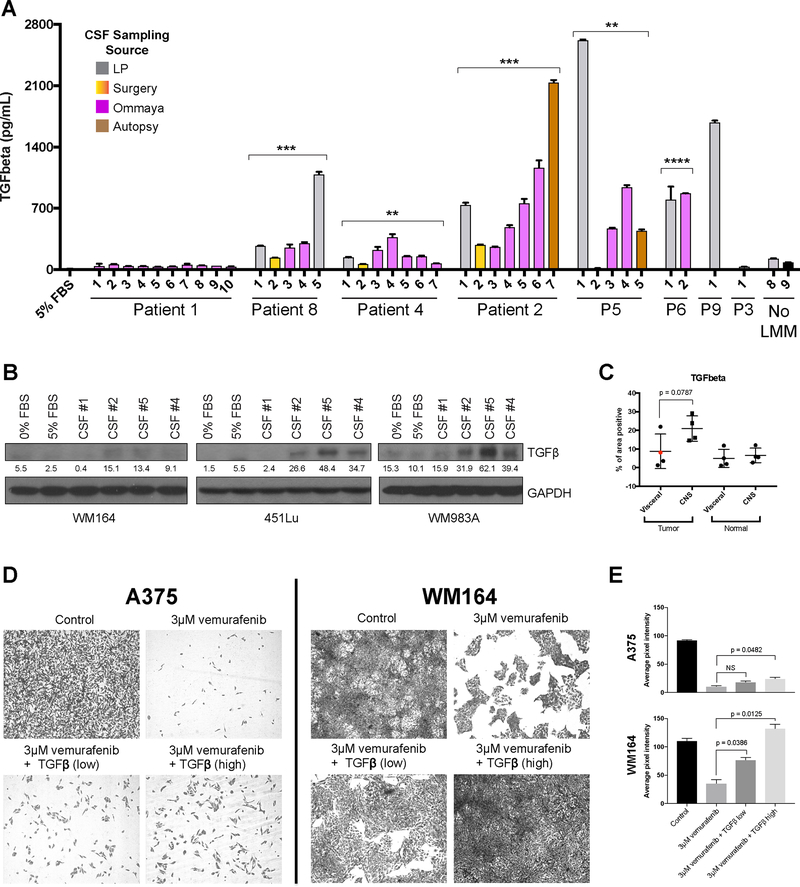
Figure 5. High TGF-β1 in CSF of patients with LMM promotes drug resistance.
A. ELISA assay showing levels of TGF-β1 in RPMI media supplemented 5% FBS and CSF specimens from patients with LMM, a cancer patient without LMM (No LMM #8) and commercially available healthy CSF (No LMM #9). Six out of seven poor responders show elevated levels of TGFβ1 in CSF compared to responder or none-LMM controls. Bar colors correspond to CSF collection source, p-values are denoted for a t-test comparing the average level of TGFβ1 over all time points for a patient compared to Patient #1 extraordinary responder (p<0.01**; p<0.001***; p<0.0001 ****). B. Western Blot analysis of lysates from WM164, 451Lu and WM983A cell lines treated with patient CSF for 8 hours confirms the increase in TGFβ (~45kDa). Quantification of TGF-β bands represent the mean pixel intensity above background. C. IHC analysis of TGF-β1 in autopsy specimens from different sites of disease in CNS and other visceral organs (site of primary shown in red dot) shows an elevated level of TGF-β1 staining in the tumor cells residing in CNS compared to tumors at visceral sites. D. Long term colony formation assays of A375 and WM164 melanoma cells treated with vemurafenib (3 μM) in the presence of absence of recombinant human TGF-β1 (high = 200pg/ml, low = 1ng/ml) for two weeks. E. Quantification of results shown in D. Data represents the average pixel intensity (inverse image) of 3 fields of view from each treatment condition.

