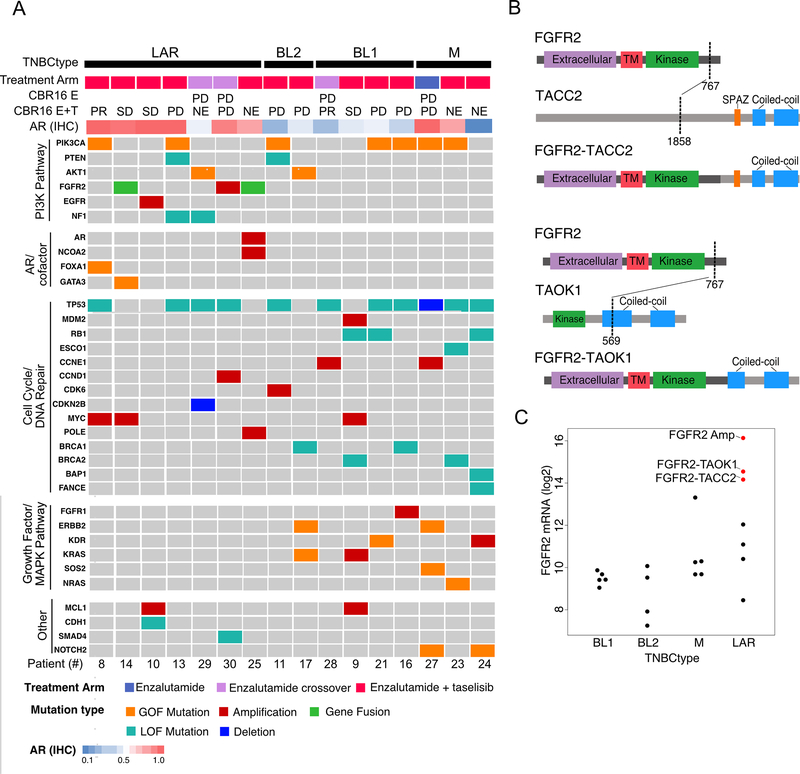
Figure 4. Genomic alterations in pre-treatment biopsies by TNBCtype.
A, Oncoplot shows the distribution of activating (gain-of-function (GOF) mutations, amplifications and gene fusions) and loss-of-function (LOF, mutations and deletions) alterations in genes organized by driver pathways and grouped by TNBC subtype. B, Diagrams show the protein domain structure of novel transcripts with FGFR2-fused to either TACC2 (upper) or TAOK1 (lower); abbreviation: TM, transmembrane. C, Beeswarm plot shows FGFR2 transcript levels by TNBCtype, with both FGFR2-amplified and FGFR2-fused tumors indicated in red. Abbreviations: CBR16, clinical benefit at 16 weeks; E, enzalutamide; T, taselisib; PD, progressive disease; SD, stable disease; PR, partial response; NE, not evaluated.

