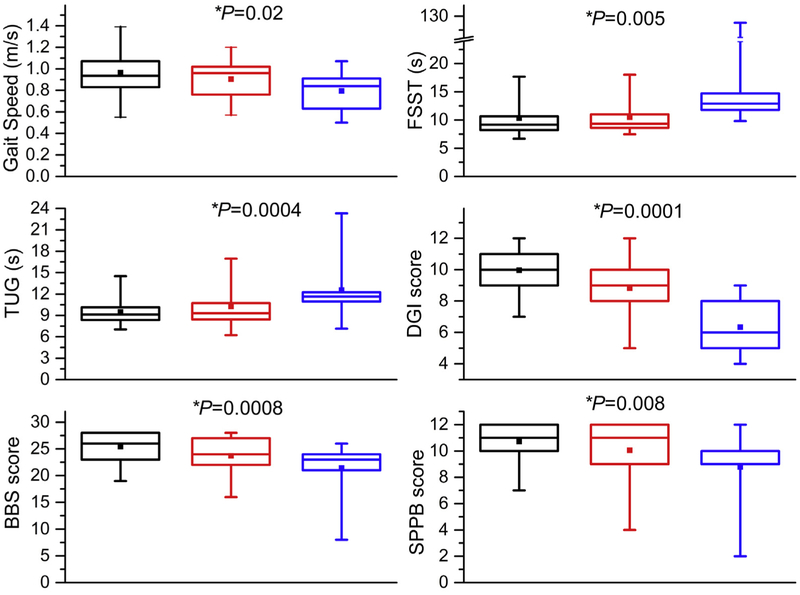
Fig 1.
Boxplots of mobility function measures (gait and balance) for participants without carotid artery stenosis (black boxes), with moderate stenosis (50%−69% diameter reducing) (red boxes) and with high-grade stenosis (70%−99% diameter reducing) (blue boxes). Median, horizontal line in the box; top line of the box, upper quartile (75th percentile); bottom line of the box, lower quartile (25th percentile); Filled square, mean. The ends of the whiskers (vertical lines) indicate the minimum and maximum values. *Adjusted P values based on logistic regression. BBS, Berg Balance Scale; DGI, Dynamic Gait Index; FSST, Four Square Step Test; SPPB, Short Physical Performance Battery; TUG, Timed Up and Go.

