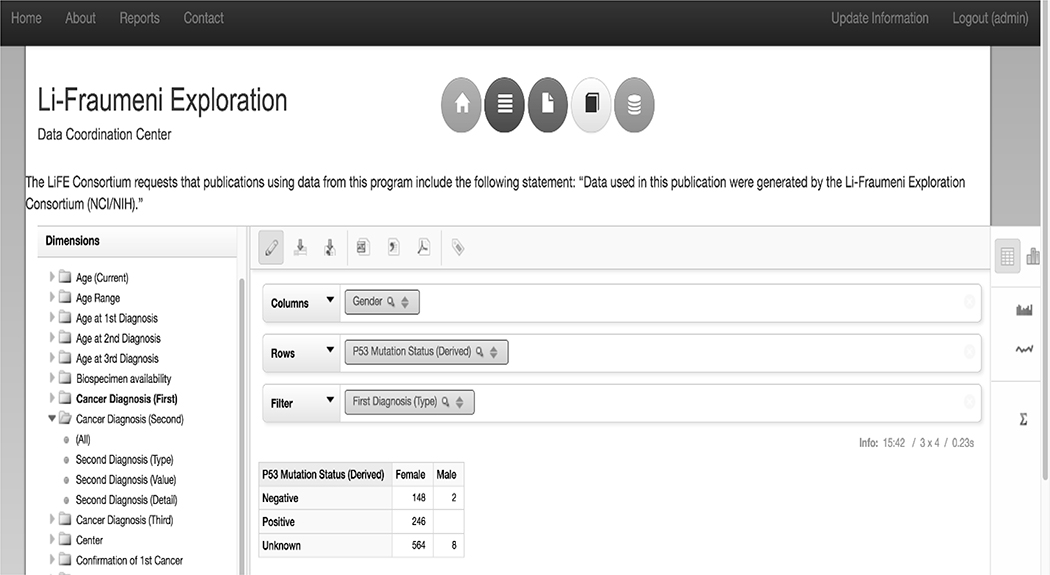
Figure 2:
The Saiku query tool allowing for authorized users to drag and drop data elements from the left Dimensions menu into columns (Gender) and rows (P53 Mutation Status (Derived)), and generate data tables. Filter capabilities (First Diagnosis (Type) = Breast Cancers) allow queries to be further narrowed down to only datasets of interest. Tables can be exported as CSV, Excel, or PDF files using the buttons above the “Column” field. Data can also be visualized in several ways utilizing the visualization tools on the right side bar.

