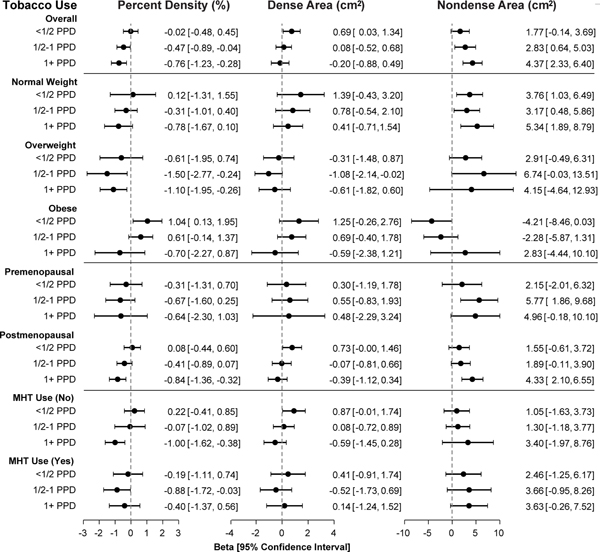
Figure 2. Associations of tobacco smoking with mammographic density phenotypes compared to non-smokers, overall and stratified by BMI category, menopausal status, and use of menopausal hormone therapy.

All models were adjusted for tobacco use, age, age2, BMI, BMI2, BMI3, late adolescent BMI, age at menarche, age at first birth, parity, menopausal status, menopausal hormone therapy (MHT) use, first-degree relative with breast cancer, physical activity, and image batch. Effects were estimated using separate linear regression models of the square-root transformed phenotype in the Hologic and GE cohorts, and combined using restricted maximum likelihood (REML) random effects meta-analysis. Coefficients (β) and 95% confidence intervals (CI) were back-transformed to the original scale. PPD = packs per day.
