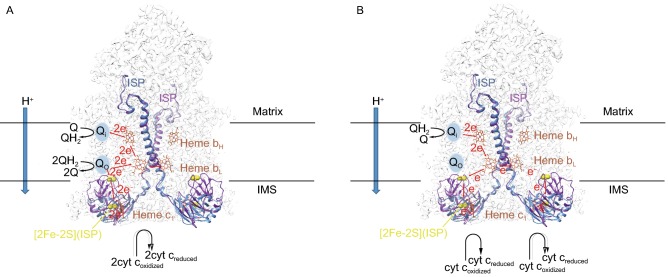
Figure 3.
Mechanisms of CIII2. (A) Diagram of Q cycle theory. The ISP proteins and catalytic centers are shown in different colors. The ISP subunit colored in blue (PDB ID: 5XTE, also called as “c1 state”) and the ISP subunit colored in purple (PDB ID: 3H1I, also called as “b state”) (Zhang et al., 1998) indicate the conformational change between two states of CIII during electron transportation. The black dotted lines represent the mitochondrial inner membrane. The black arrows represent the change of substrates. The blue arrow indicates the proton translocation direction. The red dotted lines indicates the electron flow in CIII dimer. The light blue circles represent the Q-binding site Qi and Qo. (B) Diagram of the mechanism raised in our paper. The labels are consist with Fig. 3A

