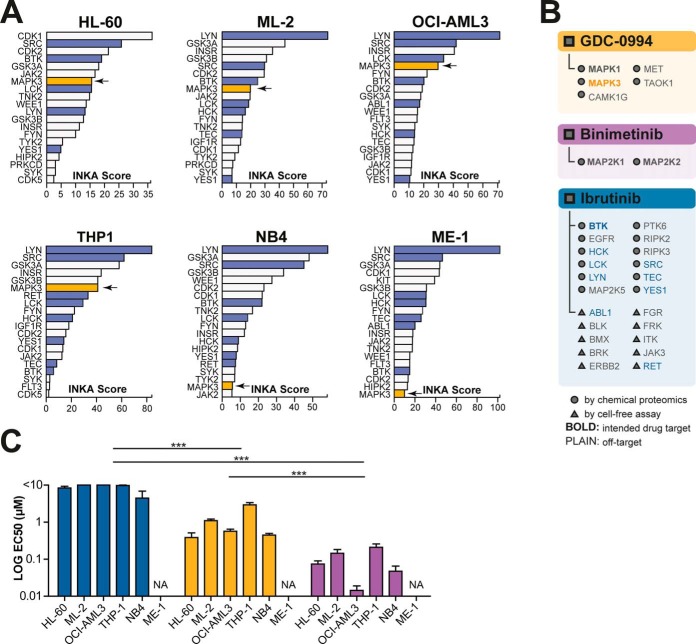
Fig. 5.
Ranking of phosphorylated kinases in six cell lines without an identified mutation or TK hyperphosphorylation. A, INKA scores of MAPK1 and MAPK3 (arrow) rank high in four out of six cell lines without a clear hyperactive TK driver. B, List of experimentally established drug targets of GDC-0994 (orange panel), binimetinib (purple panel) and ibrutinib (blue panel) with an affinity below 500 nm. As in Fig. 4, the target space (40, 42, 43), is indicated in the phosphokinase profiles. Bold font indicates kinases that are intended targets, whereas plain font indicates additional targets of the drug. Kinases with a top 20 INKA score are indicated with corresponding colors as in panel A. C, Targeting of MAPK1 and MAPK3 with GDC-0994 shows effective inhibition of cell viability in the nanomolar range compared with treatment with ibrutinib (control) (p < 0.0001, two-way ANOVA). Targeting the MAPK pathway by upstream MAP2K1 and MAP2K2 inhibition using binimetinib was even more effective (p < 0.0001 and p < 0.0001, respectively). Colors as in panel A.

