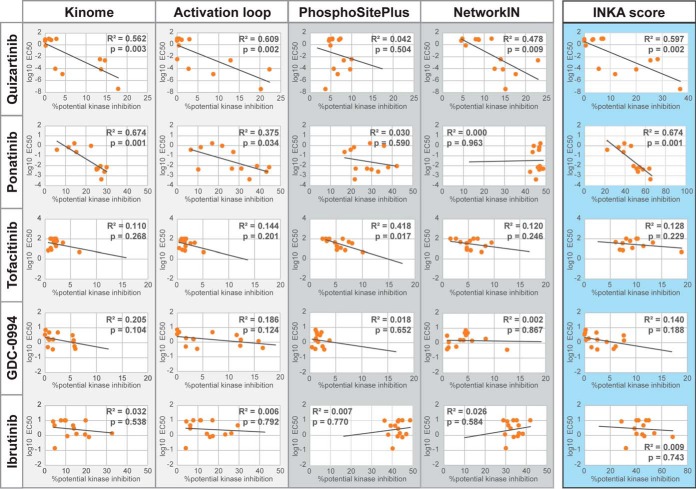
Fig. 6.
Systematic analysis of ranked inferred kinases and their INKA metrics in relation to drug EC50 values. Percentage potential kinase inhibition for quizartinib, ponatinib, ibrutinib, tofaitinib and GDC0994 was separately calculated for “Kinome”-, “Activation loop”-, “PhosphoSitePlus” (PSP)- and “NetworKIN′ (NWK)-based metrics of kinase activity as well as for the aggregate INKA score. This involves, for a given metric/score, taking the ratio of the summed values of kinases in the target space of a kinase inhibitor and the summed values of all kinases within a cell line. Log EC50 values for quizartinib, ponatinib, ibrutinib, tofaitinib and GDC0994 were compared with the percentage potential kinase inhibition of these drugs for the AML cell lines using Pearson correlation.

