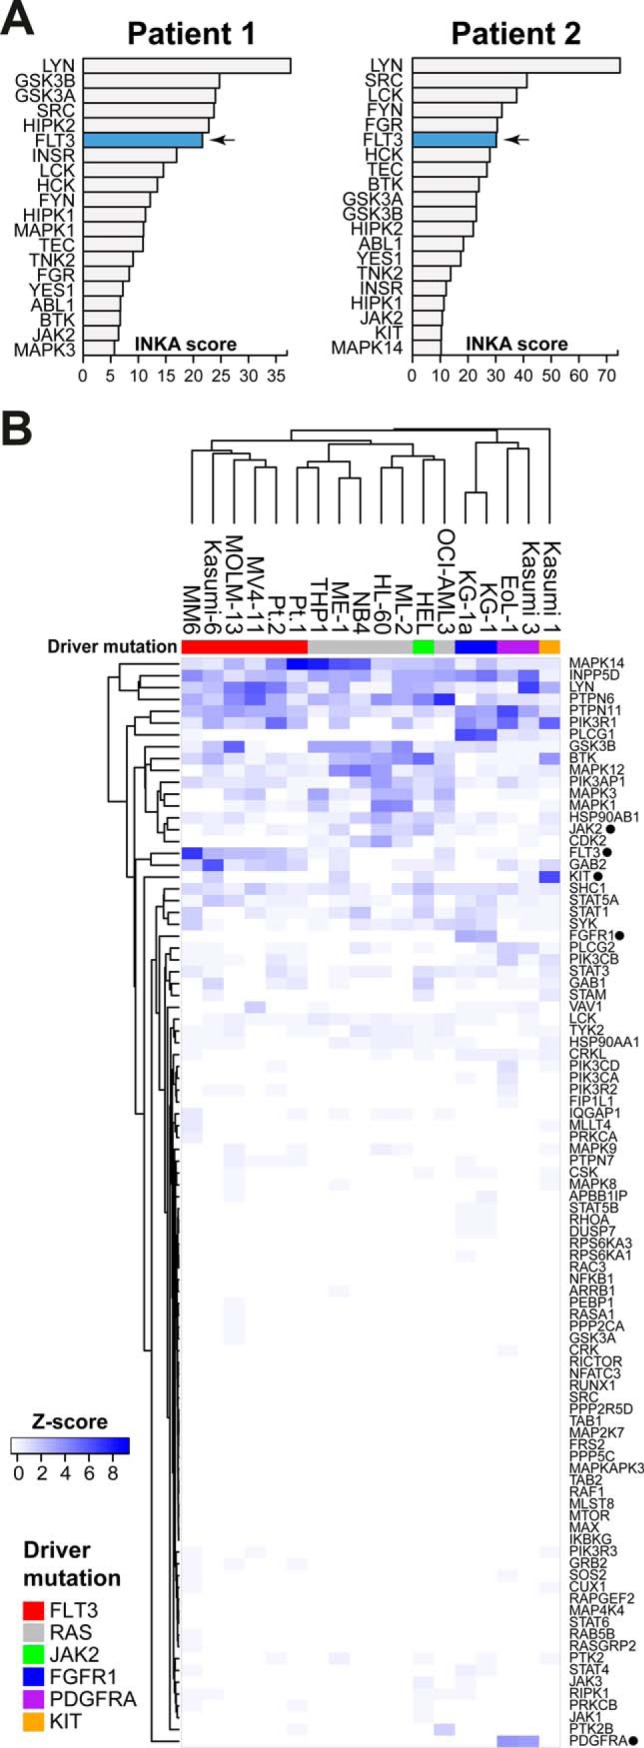
Fig. 7.

Phosphoproteome analysis of two FLT3-ITD positive patients. A, INKA score ranking of kinases for each patient sample identified FLT3 as highly active in both patients. Ranking of FLT3 was comparable to that in FLT3-ITD-positive cell lines. FLT3 is indicated in blue. B, Hierarchical clustering of all samples shows the similarity in pathway phosphorylation between cell lines and clinical samples. Samples clustered predominantly by their identified AML drivers. Clustering is based on within-sample z-scores of summed phosphopeptide counts for proteins that are part of the defined AML signaling network (supplemental Table S3).
