Fig. 7.
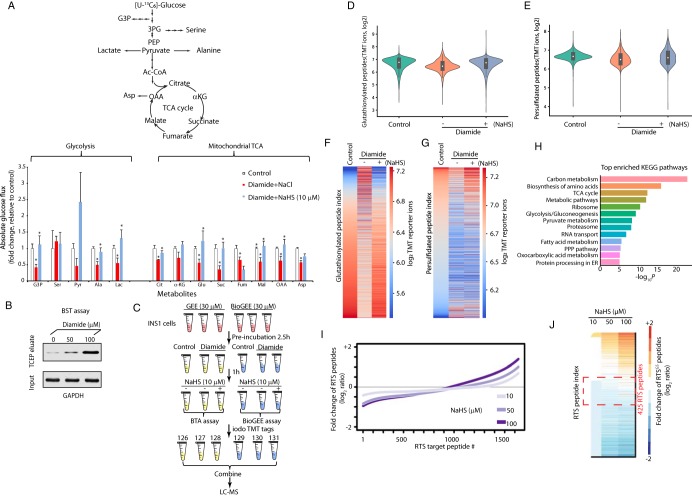
H2S restores oxidative stress-decreased metabolic flux in glycolysis and the mitochondrial TCA cycle. A, Measurement of [U-13C]-glucose flux in metabolites, expressed as the fold change of absolute glucose flux (ratio of control/treated). INS1 cells were treated with diamide (0.1 mm) in glucose-free growth medium for 90 min, then the cells were switched to 16.8 mm glucose in KRB buffer containing NaHS (0, 10 μm) for 90 min. [U-13C]-glucose replaced glucose in the KRB media for the last 90 min of treatments. 4 replicates of each condition were used. B, Evaluation of GAPDH S-glutathionylation in INS1 cells treated with diamide (0, 50 and 100 μM) at the indicated concentrations by the BST assay. INS1 cells were incubated without or with diamide for 90 min, then subjected to the BST assay to determine the levels of glutathionylated GAPDH protein using Western blot analysis (the details of experimental approach for the BST assay was described in Fig. 5B). C, Schematic workflow to identify and quantify glutathionylated and persulfidated proteins in vivo using the iodoTMT quantification proteomics approaches. INS1 cells were pre-incubated with either GEE or BioGEE (0.03 mm) for 2.5 h, then treated under the indicated conditions. After the treatments, all the GEE-treated samples were subjected to either the BTA assay for the detection of persulfidated proteins, and the samples labeled with BioGEE were subjected for the detection of glutathionylated proteins. After protein digestion and elution, all cysteine-containing peptides were labeled with the iodoTMT tags followed by LC-MS analysis. D, Violin plot showing the relative changes of S-glutathionylated peptides identified by the TMT-BioGEE assay. E, Violin plot showing the relative changes of S-persulfidated peptides identified by the TMT-BTA assay. F, Heat map showing the relative changes of S-glutathionylated peptides identified by the TMT-BioGEE assay. G, Heat map showing the relative changes of S-persulfidated peptides identified by the TMT-BTA assay. H, Gene ontology analysis of the persulfidated and glutathionylated targets in (C) showing that metabolic enzymes are highly enriched among all the identified proteins. I, Curve plot showing the dose-dependent increase of S-persulfidation levels on RTSGS peptides in the proteome treated with the H2S donor in vitro from the experimental data (supplemental Table S17). J, Heat map showing the relative changes of S-persulfidated peptides identified by the TMT-BTA assay. The RTSGS targets within the red dotted line frame showing that among the highly sensitive targets for RTSGS, are metabolic enzymes containing a redox domain with a P-loop motif.

