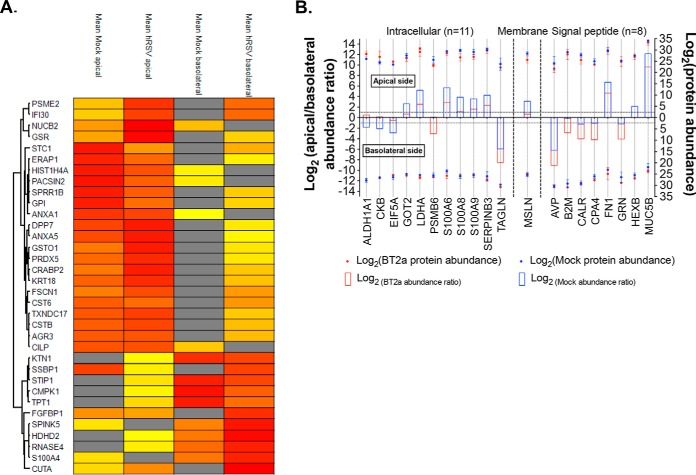
Fig. 4.
Host proteins with secretion patterns most affected by hRSV infection. A, Hierarchical clustering of proteins whose polarity of secretion was changed upon infection (n = 34). Log-2 transformed mean abundance values between replicates were Z-score-normalized. The hierarchical clustering was performed with the rows indicating individual proteins and the columns averaged replicate (yellow, low abundance; red, high abundance; gray, undetected). B, Graphical representation of the host proteins whose abundance ratios were the most disrupted upon infection (n = 20, delta fold change >2, see supplemental Table S6). For each protein (x axis), the bars represent the apical/basolateral ratios (left y axis) and the dots indicate the corresponding abundance (right y axis), in control (blue) and virus-infected (red) WD-PBEC cultures. Both protein abundance (LFQ intensity) and abundance ratios were plotted on a Log2 scale. Proteins were separated based on their predicted cellular location and the data were displayed for the apical (top) and basolateral (bottom) side.

