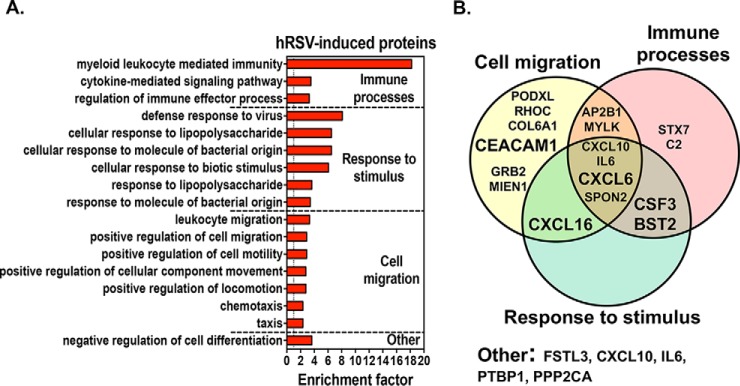
Fig. 6.
Enriched BP associated with hRSV-induced proteins. A, The most significantly enriched BP (>1, y axis) associated with hRSV-induced proteins were identified by GOBP enrichment, and further divided in functional groups. x axis, gene ontology enrichment factor. Only GO classifications with a p value <0.01 are shown. B, Venn-diagrams showing the overlap between the hRSV-induced proteins specifically associated with the enriched BPs (n = 17) and the four functional groups.

