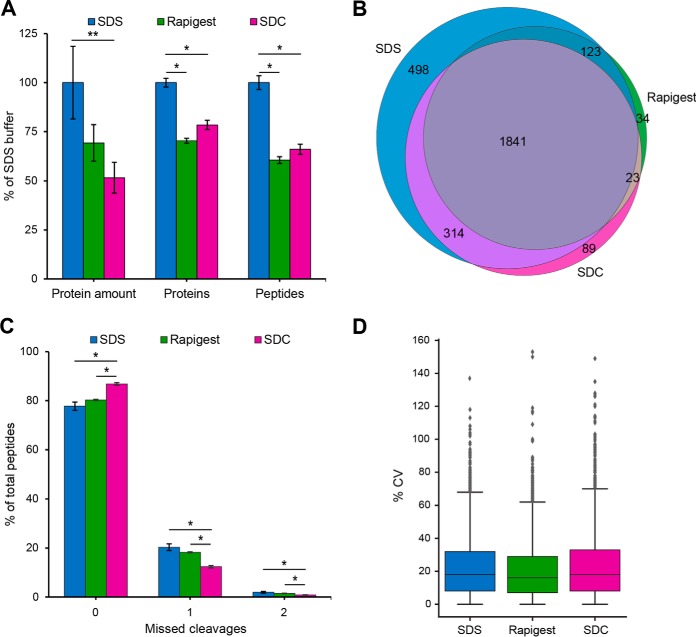
Fig. 1.
Optimization of protein extraction from FFPE tissue samples. A, Protein amount extracted from FFPE human substantia nigra (1 section, 4 μm) and number of protein groups (minimum 2 peptides per protein) and unique peptides identified using different protein extraction buffers. Data is shown as means ± S.D. (n = 4, * p ≤ 0.001, ** p ≤ 0.02) and as % of SDS buffer (100% = 45 μg protein, 2370 protein groups, 18,560 peptides). B, Venn diagram representing the number of identified protein groups, which are unique and common in samples from different extraction buffers. C, Fraction of peptides with zero, one and two missed cleavages. Data is shown as means ± S.D. (n = 4, * p ≤ 0.001). D, Box Plot showing the coefficient of variation (CV) of median-normalized protein intensities from technical replicates (n = 4).

