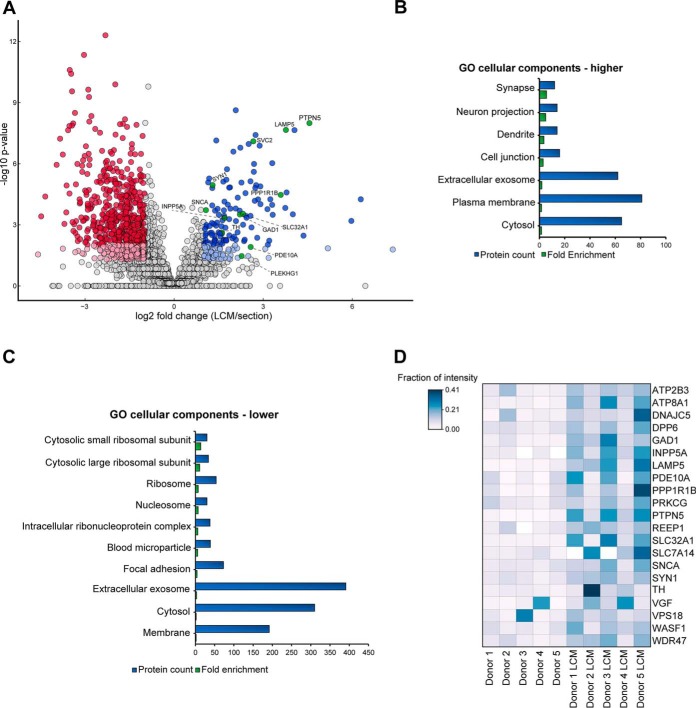
Fig. 2.
Comparison of microdissected tissue samples with intact sections. A, Volcano Plot representing the log2 fold changes in protein intensities versus the negative log10-transformed p values (two-tailed, equal variance t test) of microdissected substantia nigra (∼3000 cells) versus intact tissue sections (10 μm). Data is based on 11 replicate samples from intact sections and 13 replicates from microdissected samples, which were prepared from total 5 biological replicates. Proteins with fold changes ≥2 (blue) or ≤2 (red) and p values ≤0.01 (dark) or ≤0.05 (light) are displayed in color. Neuron-specific proteins are presented in green. B, GO cellular components enriched in microdissected substantia nigra compared with intact sections (Benjamini-corrected p value <0.01, protein count ≥10). The human proteome was used as background. C, GO cellular components with lower intensity in microdissected substantia nigra compared with intact sections (Benjamini- corrected p value <0.01, protein count ≥10). The human proteome was used as background. D, Heat map representing the fraction of intensity of microdissected samples and intact sections for neuron-specific proteins.

