Fig. 3.
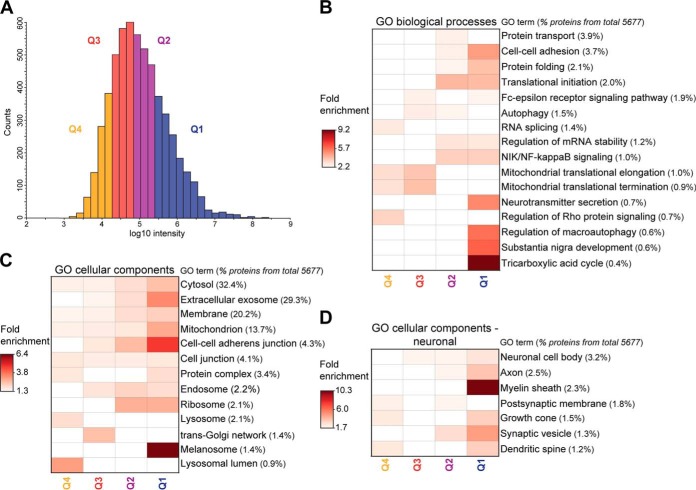
Functional enrichment of the nigral proteome. A, Histogram representing the intensity range of the nigral proteins identified. Depending on their intensity proteins were divided into four quartiles. B, Heat map showing GO biological processes, which were enriched in each of the quartiles (Benjamini-corrected p value <0.05, protein count ≥1%). C, Heat map showing GO cellular components enriched in each of the quartiles (Benjamini-corrected p value <0.05, protein count ≥1%). D, Heat map showing neuronal GO cellular components enriched in each of the quartiles (Benjamini-corrected p value <0.05, protein count ≥1%).

