
Figure 2.
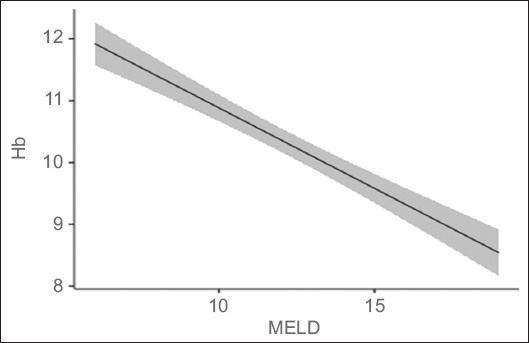
Marginal means plot of linear regression analysis showing negative correlation between hemoglobin (Hb) levels and model for end-stage liver disease (MELD) score (P<0.001)
Official websites use .gov
A
.gov website belongs to an official
government organization in the United States.
Secure .gov websites use HTTPS
A lock (
) or https:// means you've safely
connected to the .gov website. Share sensitive
information only on official, secure websites.
Marginal means plot of linear regression analysis showing negative correlation between hemoglobin (Hb) levels and model for end-stage liver disease (MELD) score (P<0.001)