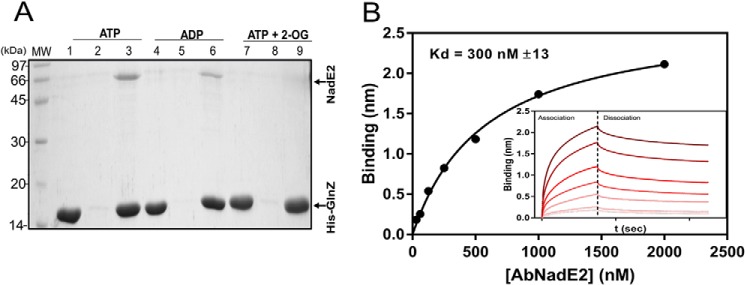
Figure 2.
In vitro complex formation between AbNadE2 and GlnZ. A, protein complex formation was assessed by pulldown using Ni2+ beads. Assays were performed in the presence of 5 mm MgCl2 and the effectors ATP, ADP, and/or 2-OG at 1 mm, as indicated. Binding reactions were conducted in 400 μl of buffer, adding purified His-GlnZ mixed with native AbNadE2. After extensive washes, bound proteins were eluted with SDS-PAGE loading buffer and analyzed by SDS-PAGE stained with Coomassie Blue. Lanes 1, 4, and 7, HisGlnZ only. Lanes 2, 5, and 8, AbNadE2 only. Lanes 3, 6, and 9, a mixture of HisGlnZ and AbNadE2. B, biolayer interferometry quantification of GlnZ-AbNadE2 interaction. His-GlnZ was immobilized on the Ni-NTA sensor tip in a concentration of 2 μg/ml. The sensor tip was then challenged in a solution containing the indicated AbNadE2 concentrations in the presence of 5 mm MgCl2 and 1 mm ATP. Insert, plots reporting the Δλ spectral shift in nm versus time in response to increasing AbNadE2 concentrations. The binding curves and Kd were determined and calculated using the manufactureŕs software (FortéBio) with the determined association and dissociation rates (kON = 9.09 × 10⁴ m−1 s−1, kOFF = 2.72 × 10⁻² s−1).

