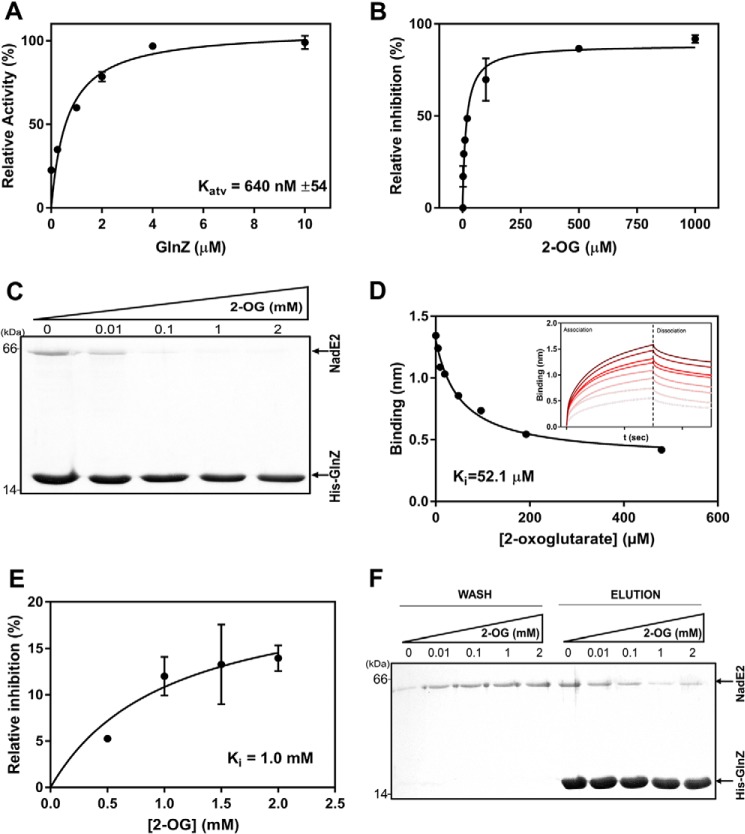
Figure 4.
Effect of 2-oxoglutarate in the dissociation of GlnZ-NadE2Ab complex and enzymatic activity of AbNadE2. NadE2 discontinuous assays were performed to measure the formation of PPi in the presence of 4 mm l-glutamine, 4 mm ATP, and 2 mm NaAD. Data were plotted as relative percent activity considering the reaction without NAD+ as 100% activity. A, reactions contained 100 nm NadE2Ab and 2.5 mm of NAD+. GlnZ was added at 0.25, 1, 2, 4, and 10 μm (trimer). The estimated Kd for the AbNadE2-GlnZ complex was 640 nm and was calculated using nonlinear regression in GraphPad Prism 7. B, the activity of AbNadE2 in the presence of GlnZ is regulated by the levels of 2-OG. Data were plotted as percent inhibition relative to the AbNadE2 activity in the presence of NAD+, which was considered as 100% inhibition. Assays were performed in the presence of 2.5 mm NAD+, 2 μm GlnZ, and increasing 2-OG concentrations. The estimated IC50 (Ki) of 2-OG was 15.5 μm. C, the formation of the GlnZ-AbNadE2 complex was assessed by pulldown using Ni2+ beads. Reactions were performed in the presence of MgCl2 5 mm, 1 mm ATP, and increasing concentrations of 2-OG as indicated. Binding reactions were conducted in 400 μl of buffer, adding purified His-GlnZ and untagged AbNadE2. After extensive washes, bound proteins were eluted with SDS-PAGE loading buffer and analyzed by SDS-PAGE stained with Coomassie Blue. D, biolayer interferometry analysis of the GlnZ-AbNadE2 complex. The His-GlnZ was immobilized in the Ni-NTA sensor tip. The tip was then steeped in a solution containing 400 nm AbNadE2, MgCl2 5 mm, 1 mm ATP, and different concentrations of 2-OG. Insert, plots reporting the Δλ spectral shift in nm versus time under different 2-OG concentrations. The binding curves and Ki were determined using the manufactureŕs software (FortéBio). E, curve of AbNadE2 relative inhibition in response to increasing 2-OG concentrations. The AbNadE2 inhibition in the presence of 5 mm NAD+ is considered 100% inhibition. Reactions were carried in the presence of 2.5 mm NAD+ and 2 μm GlnZ. The GlnZ and NadE2 proteins were preincubated in MgATP before the addition of 2-OG and the start of the reaction. Hence, this assay reflects the ability of 2-OG to dissociate a pre-formed GlnZ-AbNadE2 complex. The estimated Ki for 2-OG was 1 mm and calculated nonlinear regression in GraphPad Prism 7. F, the HisGlnZ-NadE2 complex was immobilized on Ni2+ beads in the presence of 1 mm ATP. Beads were washed (Wash) with buffer containing ATP (1 mm) and the indicated 2-OG concentrations. Bound proteins were eluted in SDS-PAGE sample buffer (Elution). The samples were applied to SDS-PAGE 15%, and the gels were stained with Coomassie Blue.

