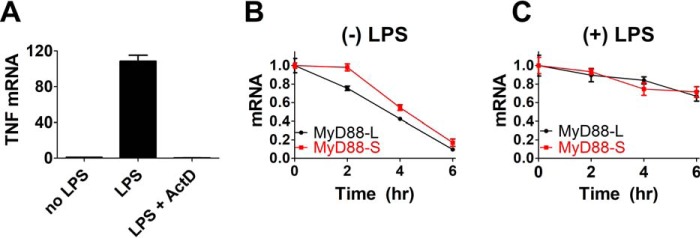
Figure 2.
Both MyD88 isoforms have similar half-lives. A, to verify that actinomycin D was inhibiting transcription, RAW264.7 cells were treated with LPS (200 ng/ml) for 2 h in either the presence or absence of actinomycin D (50 μg/ml). Total RNA was then purified, and TNFα mRNA levels were monitored by qPCR. Data are presented as mean ± S.E. (error bars) with the data normalized so that TNFα expression in the absence of LPS is set to 1. B and C, RAW264.7 macrophages were treated with 200 ng/ml LPS for 24 h (C) or were left untreated (B) as a control. 50 μg/ml actinomycin D was then added to inhibit transcription, and decay of MyD88-L and MyD88-S mRNA was monitored by qPCR at the indicated time points. Time 0 is the time of the addition of actinomycin D; MyD88-L and MyD88-S levels are normalized so that they are both set to 1 at this time point. Note that there is substantially more MyD88-L than MyD88-S present in cells in the absence of LPS treatment; the figure depicts mRNA of each isoform relative to the starting concentration of that isoform. Additionally, MyD88-S levels at time 0 (after 24-h LPS exposure) in C are 2.2 ± 0.2 times greater than MyD88-S levels in the absence of LPS in B. All experiments represent a minimum of three independent biological replicates.

