Figure 5.
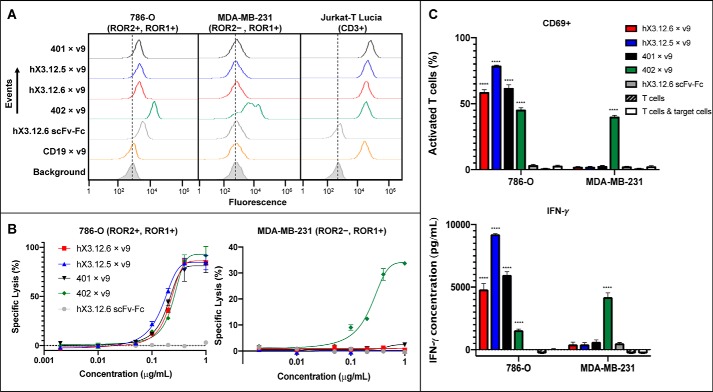
Activity of ROR2 × CD3 biAbs. A, the indicated ROR2 × CD3 biAbs along with control ROR1 × CD3 and CD19 × CD3 biAbs (all in heterodimeric scFv-Fc format) at 1 μg/ml in conjunction with Alexa Fluor 647–conjugated donkey anti-human F(ab′)2 pAbs were used to stain 786-O, MDA-MB-231, and Jurkat-T Lucia cells to confirm specific binding to ROR2 and CD3. Secondary antibody alone (Background; gray shade) served as negative control. B, a panel of ROR2 × CD3 biAbs based on the humanized and affinity-matured mAbs and the parental mAb was compared with a ROR1 × CD3 biAb (all in heterodimeric scFv-Fc format) and a monospecific negative control without T cell–engaging arm. Plotted is the specific lysis of cell lines 786-O (ROR2+, ROR1+) and MDA-MB-231 (ROR2+, ROR1−) after a 16-h incubation with the indicated range of biAb concentrations and ex vivo expanded T cells at an effector/target cell ratio of 10:1. T-cell activation was measured as percentage of CD69+ T cells determined by flow cytometry and cytokine IFN-γ release determined by ELISA (C). Based on independent triplicates shown as mean ± S.D. (error bars), one-way analysis of variance was used to analyze significant differences between ROR2 × CD3 (or ROR1 × CD3) biAbs and the monospecific scFv-Fc negative control (****, p < 0.0001).

